메모
전체 예제 코드를 다운로드 하려면 여기 를 클릭 하십시오.
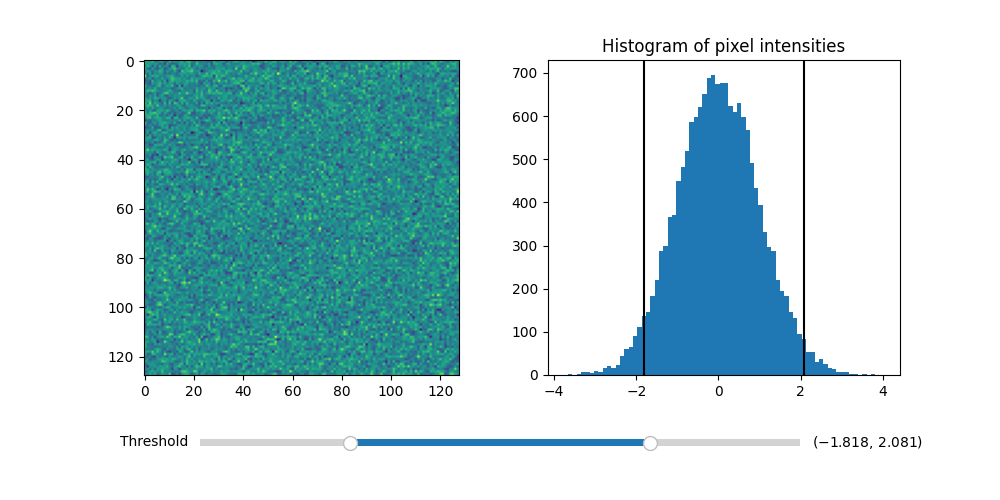
RangeSlider로 이미지 임계값 지정하기 #
RangeSlider 위젯을 사용하여 이미지의 임계값을 제어합니다.
RangeSlider 위젯은 widgets.Slider
위젯과 유사하게 사용할 수 있습니다. 주요 차이점은 RangeSlider의 val특성이 단일 플로트가 아닌 플로트 튜플이라는 것입니다.(lower val, upper val)
a를 사용 하여 단일 플로트를 제어 하는 예는 Slider 를 참조하십시오 .Slider
불연속 값에 스냅 하는 예는 슬라이더를 불연속 값에 스냅을 참조하십시오 Slider.
import numpy as np
import matplotlib.pyplot as plt
from matplotlib.widgets import RangeSlider

# generate a fake image
np.random.seed(19680801)
N = 128
img = np.random.randn(N, N)

fig, axs = plt.subplots(1, 2, figsize=(10, 5))
fig.subplots_adjust(bottom=0.25)

im = axs[0].imshow(img)
axs[1].hist(img.flatten(), bins='auto')
axs[1].set_title('Histogram of pixel intensities')

# Create the RangeSlider
slider_ax = fig.add_axes([0.20, 0.1, 0.60, 0.03])
slider = RangeSlider(slider_ax, "Threshold", img.min(), img.max())

# Create the Vertical lines on the histogram
lower_limit_line = axs[1].axvline(slider.val[0], color='k')
upper_limit_line = axs[1].axvline(slider.val[1], color='k')


def update(val):
    # The val passed to a callback by the RangeSlider will
    # be a tuple of (min, max)

    # Update the image's colormap
    im.norm.vmin = val[0]
    im.norm.vmax = val[1]

    # Update the position of the vertical lines
    lower_limit_line.set_xdata([val[0], val[0]])
    upper_limit_line.set_xdata([val[1], val[1]])

    # Redraw the figure to ensure it updates
    fig.canvas.draw_idle()


slider.on_changed(update)
plt.show()