메모
전체 예제 코드를 다운로드 하려면 여기 를 클릭 하십시오.
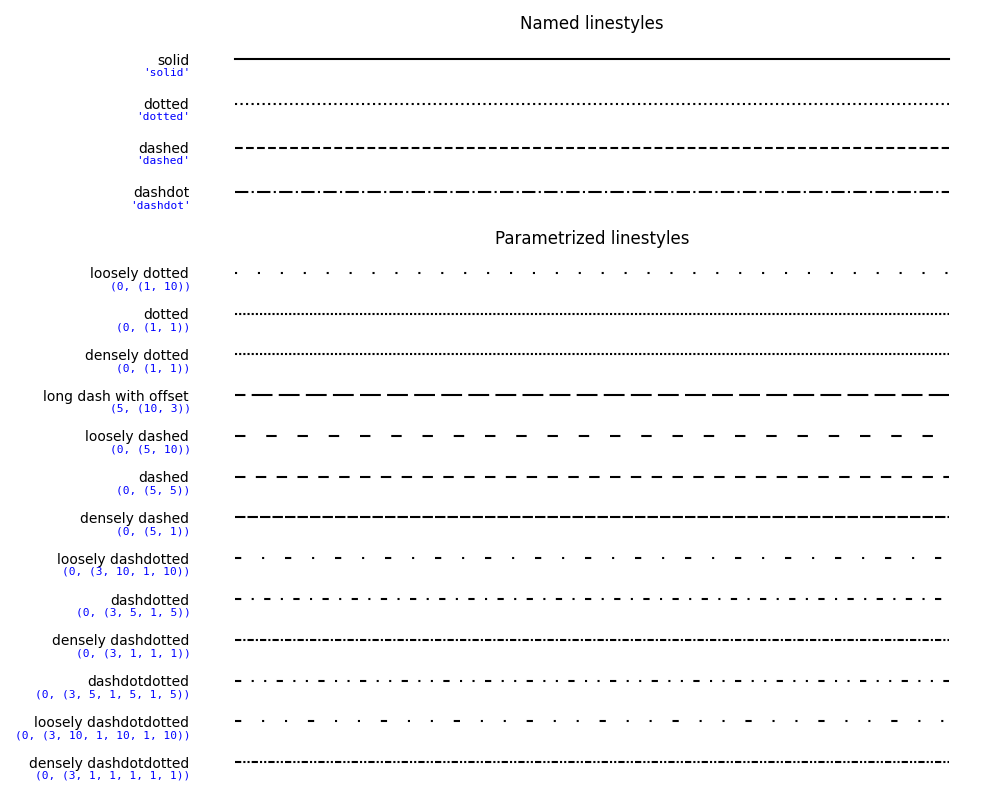
선 스타일 #
단순 선 스타일은 "solid", "dotted", "dashed" 또는 "dashdot" 문자열을 사용하여 정의할 수 있습니다. 대시 튜플을 제공하여 보다 정교한 제어를 달성할 수 있습니다
. 예를 들어, 는 오프셋이 없는 (3pt 줄, 10pt 공백, 1pt 줄, 15pt 공백)을
의미하고, 는 (10pt 줄, 3pt 공백)을 의미하지만 처음 5pt 줄은 건너뜁니다. 또한 참조하십시오 .(offset, (on_off_seq))(0, (3, 10, 1, 15))(5, (10, 3))Line2D.set_linestyle
참고 : 대시 스타일은 점선 스타일 사용자 지정 및 property_cycle 의 cycler에 dashes
키워드를 사용하여 대시 시퀀스 목록 전달에 Line2D.set_dashes
표시된 대로 구성할 수도 있습니다 .
import numpy as np
import matplotlib.pyplot as plt

linestyle_str = [
     ('solid', 'solid'),      # Same as (0, ()) or '-'
     ('dotted', 'dotted'),    # Same as (0, (1, 1)) or ':'
     ('dashed', 'dashed'),    # Same as '--'
     ('dashdot', 'dashdot')]  # Same as '-.'

linestyle_tuple = [
     ('loosely dotted',        (0, (1, 10))),
     ('dotted',                (0, (1, 1))),
     ('densely dotted',        (0, (1, 1))),
     ('long dash with offset', (5, (10, 3))),
     ('loosely dashed',        (0, (5, 10))),
     ('dashed',                (0, (5, 5))),
     ('densely dashed',        (0, (5, 1))),

     ('loosely dashdotted',    (0, (3, 10, 1, 10))),
     ('dashdotted',            (0, (3, 5, 1, 5))),
     ('densely dashdotted',    (0, (3, 1, 1, 1))),

     ('dashdotdotted',         (0, (3, 5, 1, 5, 1, 5))),
     ('loosely dashdotdotted', (0, (3, 10, 1, 10, 1, 10))),
     ('densely dashdotdotted', (0, (3, 1, 1, 1, 1, 1)))]


def plot_linestyles(ax, linestyles, title):
    X, Y = np.linspace(0, 100, 10), np.zeros(10)
    yticklabels = []

    for i, (name, linestyle) in enumerate(linestyles):
        ax.plot(X, Y+i, linestyle=linestyle, linewidth=1.5, color='black')
        yticklabels.append(name)

    ax.set_title(title)
    ax.set(ylim=(-0.5, len(linestyles)-0.5),
           yticks=np.arange(len(linestyles)),
           yticklabels=yticklabels)
    ax.tick_params(left=False, bottom=False, labelbottom=False)
    ax.spines[:].set_visible(False)

    # For each line style, add a text annotation with a small offset from
    # the reference point (0 in Axes coords, y tick value in Data coords).
    for i, (name, linestyle) in enumerate(linestyles):
        ax.annotate(repr(linestyle),
                    xy=(0.0, i), xycoords=ax.get_yaxis_transform(),
                    xytext=(-6, -12), textcoords='offset points',
                    color="blue", fontsize=8, ha="right", family="monospace")


fig, (ax0, ax1) = plt.subplots(2, 1, figsize=(10, 8), height_ratios=[1, 3])

plot_linestyles(ax0, linestyle_str[::-1], title='Named linestyles')
plot_linestyles(ax1, linestyle_tuple[::-1], title='Parametrized linestyles')

plt.tight_layout()
plt.show()