메모
전체 예제 코드를 다운로드 하려면 여기 를 클릭 하십시오.
제한된 레이아웃으로 축 크기 조정 #
제한된 레이아웃은 좌표축 객체와 좌표축의 레이블 간에 겹치지 않도록 Figure의 서브플롯 크기를 조정하려고 시도합니다.
자세한 내용은 Constrained Layout Guide 를 , 대안은 Tight Layout 가이드 를 참조하세요 .
import matplotlib.pyplot as plt


def example_plot(ax):
    ax.plot([1, 2])
    ax.set_xlabel('x-label', fontsize=12)
    ax.set_ylabel('y-label', fontsize=12)
    ax.set_title('Title', fontsize=14)
constrained_layout을 사용하지 않으면 레이블이 축과 겹칩니다.
fig, axs = plt.subplots(nrows=2, ncols=2, constrained_layout=False)

for ax in axs.flat:
    example_plot(ax)

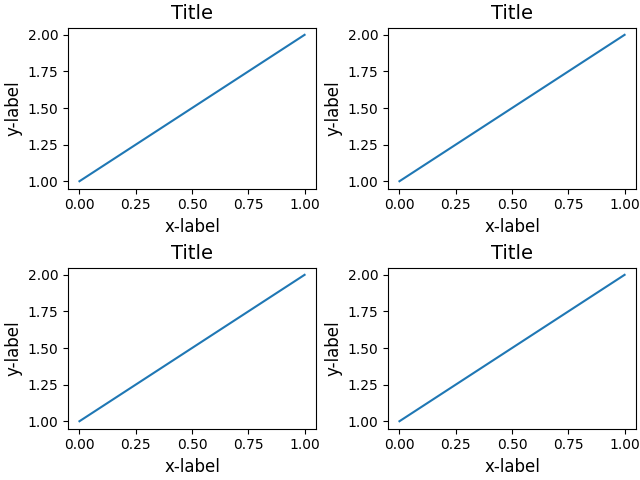
추가하면 constrained_layout=True자동으로 조정됩니다.
fig, axs = plt.subplots(nrows=2, ncols=2, constrained_layout=True)

for ax in axs.flat:
    example_plot(ax)
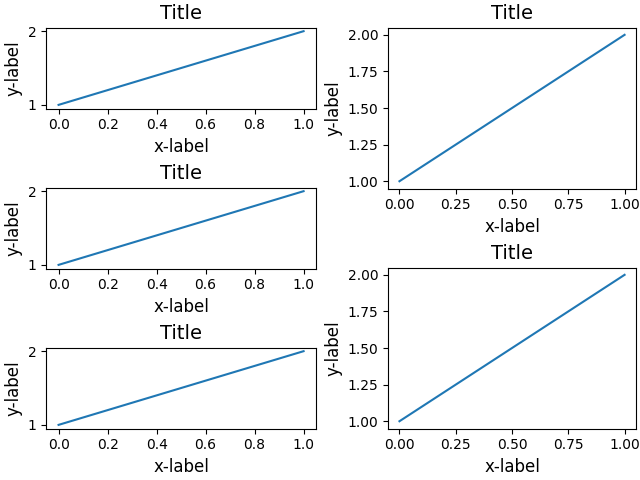
다음은 중첩된 그리드 사양을 사용하는 더 복잡한 예입니다.
fig = plt.figure(constrained_layout=True)

import matplotlib.gridspec as gridspec

gs0 = gridspec.GridSpec(1, 2, figure=fig)

gs1 = gridspec.GridSpecFromSubplotSpec(3, 1, subplot_spec=gs0[0])
for n in range(3):
    ax = fig.add_subplot(gs1[n])
    example_plot(ax)


gs2 = gridspec.GridSpecFromSubplotSpec(2, 1, subplot_spec=gs0[1])
for n in range(2):
    ax = fig.add_subplot(gs2[n])
    example_plot(ax)

plt.show()
참조
다음 함수, 메서드, 클래스 및 모듈의 사용이 이 예제에 표시됩니다.
스크립트의 총 실행 시간: ( 0분 2.712초)