메모
전체 예제 코드를 다운로드 하려면 여기 를 클릭 하십시오.
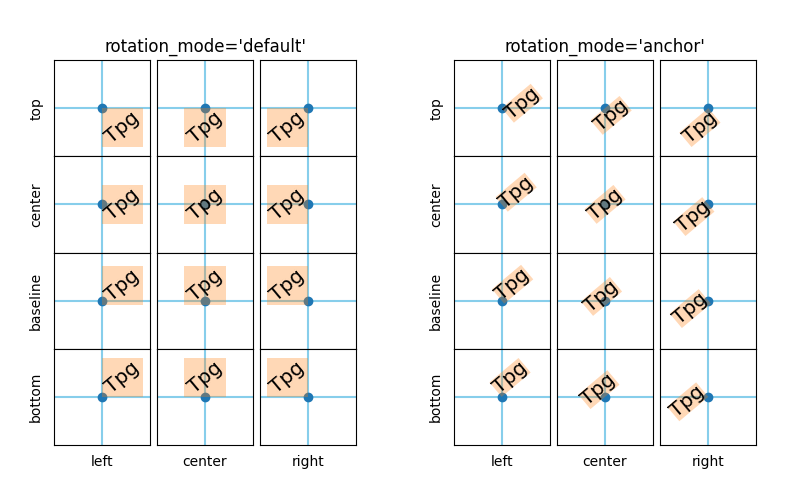
텍스트 회전 모드 #
이 예 rotation_mode는 회전된 텍스트의 위치 지정에 미치는 영향을 보여줍니다.
Rotated 는 생성자 또는 축의 메서드에 Text매개변수를 전달하여 생성됩니다 .rotationtext
horizontalalignment실제 위치 지정은 추가 매개 변수 verticalalignment및 에 따라 다릅니다
rotation_mode.
rotation_mode회전 및 정렬 순서를 결정합니다.
rotation_mode='default'(또는 없음)은 먼저 텍스트를 회전한 다음 회전된 텍스트의 경계 상자를 정렬합니다.rotation_mode='anchor'회전되지 않은 텍스트를 정렬한 다음 정렬 지점을 기준으로 텍스트를 회전합니다.
import matplotlib.pyplot as plt


def test_rotation_mode(fig, mode):
    ha_list = ["left", "center", "right"]
    va_list = ["top", "center", "baseline", "bottom"]
    axs = fig.subplots(len(va_list), len(ha_list), sharex=True, sharey=True,
                       subplot_kw=dict(aspect=1),
                       gridspec_kw=dict(hspace=0, wspace=0))

    # labels and title
    for ha, ax in zip(ha_list, axs[-1, :]):
        ax.set_xlabel(ha)
    for va, ax in zip(va_list, axs[:, 0]):
        ax.set_ylabel(va)
    axs[0, 1].set_title(f"rotation_mode='{mode}'", size="large")

    kw = (
        {} if mode == "default" else
        {"bbox": dict(boxstyle="square,pad=0.", ec="none", fc="C1", alpha=0.3)}
    )

    texts = {}

    # use a different text alignment in each axes
    for i, va in enumerate(va_list):
        for j, ha in enumerate(ha_list):
            ax = axs[i, j]
            # prepare axes layout
            ax.set(xticks=[], yticks=[])
            ax.axvline(0.5, color="skyblue", zorder=0)
            ax.axhline(0.5, color="skyblue", zorder=0)
            ax.plot(0.5, 0.5, color="C0", marker="o", zorder=1)
            # add text with rotation and alignment settings
            tx = ax.text(0.5, 0.5, "Tpg",
                         size="x-large", rotation=40,
                         horizontalalignment=ha, verticalalignment=va,
                         rotation_mode=mode, **kw)
            texts[ax] = tx

    if mode == "default":
        # highlight bbox
        fig.canvas.draw()
        for ax, text in texts.items():
            bb = text.get_window_extent().transformed(ax.transData.inverted())
            rect = plt.Rectangle((bb.x0, bb.y0), bb.width, bb.height,
                                 facecolor="C1", alpha=0.3, zorder=2)
            ax.add_patch(rect)


fig = plt.figure(figsize=(8, 5))
subfigs = fig.subfigures(1, 2)
test_rotation_mode(subfigs[0], "default")
test_rotation_mode(subfigs[1], "anchor")
plt.show()