메모
전체 예제 코드를 다운로드 하려면 여기 를 클릭 하십시오.
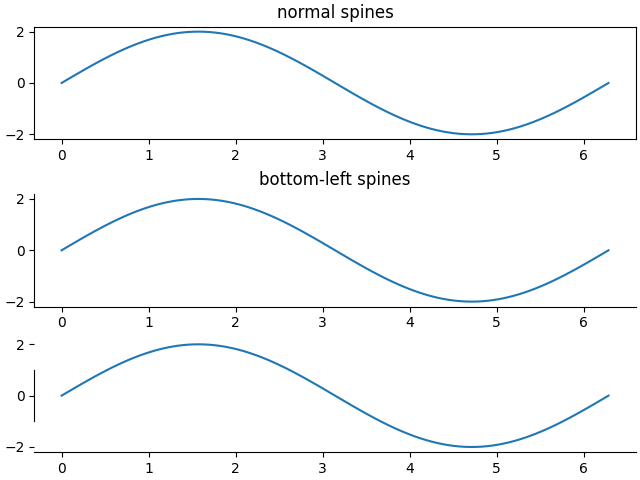
등뼈 #
이 데모는 다음을 비교합니다.
4면 모두에 가시가 있는 일반 축;
왼쪽과 아래쪽에만 가시가 있는 축;
척추의 범위를 제한하기 위해 사용자 지정 범위를 사용하는 Axes.
각각 에는 컨테이너를 통해 액세스할 수 있는 개체 axes.Axes목록이 있습니다 .Spineax.spines
import numpy as np
import matplotlib.pyplot as plt


x = np.linspace(0, 2 * np.pi, 100)
y = 2 * np.sin(x)

# Constrained layout makes sure the labels don't overlap the axes.
fig, (ax0, ax1, ax2) = plt.subplots(nrows=3, constrained_layout=True)

ax0.plot(x, y)
ax0.set_title('normal spines')

ax1.plot(x, y)
ax1.set_title('bottom-left spines')

# Hide the right and top spines
ax1.spines.right.set_visible(False)
ax1.spines.top.set_visible(False)
# Only show ticks on the left and bottom spines
ax1.yaxis.set_ticks_position('left')
ax1.xaxis.set_ticks_position('bottom')

ax2.plot(x, y)

# Only draw spine between the y-ticks
ax2.spines.left.set_bounds(-1, 1)
# Hide the right and top spines
ax2.spines.right.set_visible(False)
ax2.spines.top.set_visible(False)
# Only show ticks on the left and bottom spines
ax2.yaxis.set_ticks_position('left')
ax2.xaxis.set_ticks_position('bottom')

plt.show()

# .. admonition:: References
#
#    The use of the following functions, methods, classes and modules is shown
#    in this example:
#
#    - `matplotlib.Spines.set_visible`
#    - `matplotlib.Spines.set_bounds`
#    - `matplotlib.axis.set_ticks_position`