메모
전체 예제 코드를 다운로드 하려면 여기 를 클릭 하십시오.
Rc # 사용자 지정
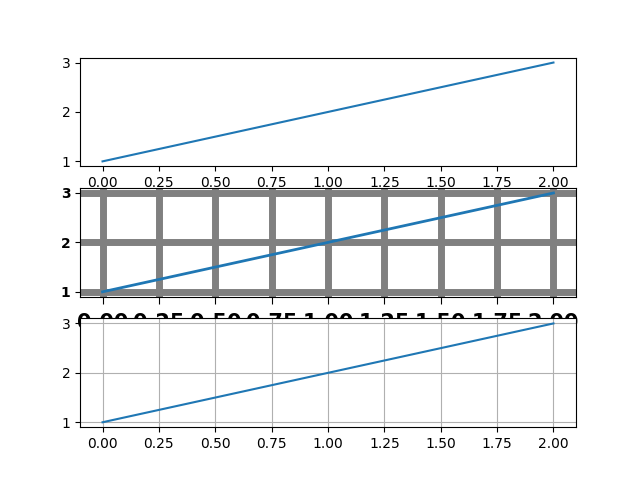
여기에서 보기 좋은 그림을 만들려고 하는 것이 아니라 rcParams즉석에서 사용자 지정하는 몇 가지 예를 보여 주기 위한 것입니다.
대화식으로 작업하고 그림에 대해 다른 기본값 세트(예: 게시용 기본값 세트, 대화식 탐색용 세트)를 생성해야 하는 경우 기본값을 설정하는 사용자 정의 모듈에서 일부 기능을 정의할 수 있습니다. 예:
def set_pub():
    rcParams.update({
        "font.weight": "bold",  # bold fonts
        "tick.labelsize": 15,   # large tick labels
        "lines.linewidth": 1,   # thick lines
        "lines.color": "k",     # black lines
        "grid.color": "0.5",    # gray gridlines
        "grid.linestyle": "-",  # solid gridlines
        "grid.linewidth": 0.5,  # thin gridlines
        "savefig.dpi": 300,     # higher resolution output.
    })
그런 다음 대화식으로 작업할 때 다음을 수행하면 됩니다.
>>> set_pub()
>>> plot([1, 2, 3])
>>> savefig('myfig')
>>> rcdefaults()  # restore the defaults

import matplotlib.pyplot as plt

plt.subplot(311)
plt.plot([1, 2, 3])

# the axes attributes need to be set before the call to subplot
plt.rcParams.update({
    "font.weight": "bold",
    "xtick.major.size": 5,
    "xtick.major.pad": 7,
    "xtick.labelsize": 15,
    "grid.color": "0.5",
    "grid.linestyle": "-",
    "grid.linewidth": 5,
    "lines.linewidth": 2,
    "lines.color": "g",
})
plt.subplot(312)
plt.plot([1, 2, 3])
plt.grid(True)

plt.rcdefaults()
plt.subplot(313)
plt.plot([1, 2, 3])
plt.grid(True)
plt.show()