메모
전체 예제 코드를 다운로드 하려면 여기 를 클릭 하십시오.
명명된 색상 목록 #
이것은 matplotlib에서 지원되는 명명된 색상 목록을 플로팅합니다. matplotlib의 색상에 대한 자세한 내용은 다음을 참조하십시오.
색상 지정 튜토리얼 ;
matplotlib.colorsAPI ;색상 데모 .
플로팅을 위한 도우미 함수 #
먼저 색상 표를 만들기 위한 도우미 함수를 정의한 다음 몇 가지 일반적인 색상 범주에 사용합니다.
from matplotlib.patches import Rectangle
import matplotlib.pyplot as plt
import matplotlib.colors as mcolors


def plot_colortable(colors, sort_colors=True, emptycols=0):

    cell_width = 212
    cell_height = 22
    swatch_width = 48
    margin = 12

    # Sort colors by hue, saturation, value and name.
    if sort_colors is True:
        by_hsv = sorted((tuple(mcolors.rgb_to_hsv(mcolors.to_rgb(color))),
                         name)
                        for name, color in colors.items())
        names = [name for hsv, name in by_hsv]
    else:
        names = list(colors)

    n = len(names)
    ncols = 4 - emptycols
    nrows = n // ncols + int(n % ncols > 0)

    width = cell_width * 4 + 2 * margin
    height = cell_height * nrows + 2 * margin
    dpi = 72

    fig, ax = plt.subplots(figsize=(width / dpi, height / dpi), dpi=dpi)
    fig.subplots_adjust(margin/width, margin/height,
                        (width-margin)/width, (height-margin)/height)
    ax.set_xlim(0, cell_width * 4)
    ax.set_ylim(cell_height * (nrows-0.5), -cell_height/2.)
    ax.yaxis.set_visible(False)
    ax.xaxis.set_visible(False)
    ax.set_axis_off()

    for i, name in enumerate(names):
        row = i % nrows
        col = i // nrows
        y = row * cell_height

        swatch_start_x = cell_width * col
        text_pos_x = cell_width * col + swatch_width + 7

        ax.text(text_pos_x, y, name, fontsize=14,
                horizontalalignment='left',
                verticalalignment='center')

        ax.add_patch(
            Rectangle(xy=(swatch_start_x, y-9), width=swatch_width,
                      height=18, facecolor=colors[name], edgecolor='0.7')
        )

    return fig
기본 색상 #
plot_colortable(mcolors.BASE_COLORS, sort_colors=False, emptycols=1)
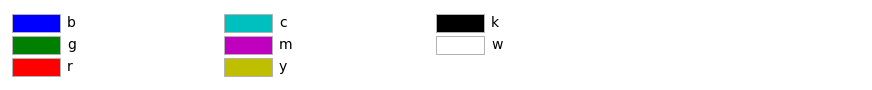
<Figure size 872x90 with 1 Axes>
태블로 팔레트 #
plot_colortable(mcolors.TABLEAU_COLORS, sort_colors=False, emptycols=2)
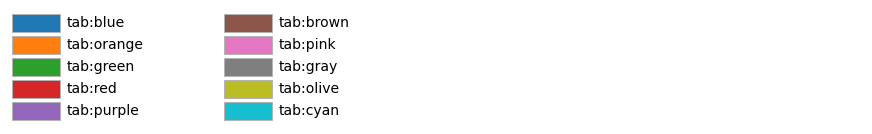
<Figure size 872x134 with 1 Axes>
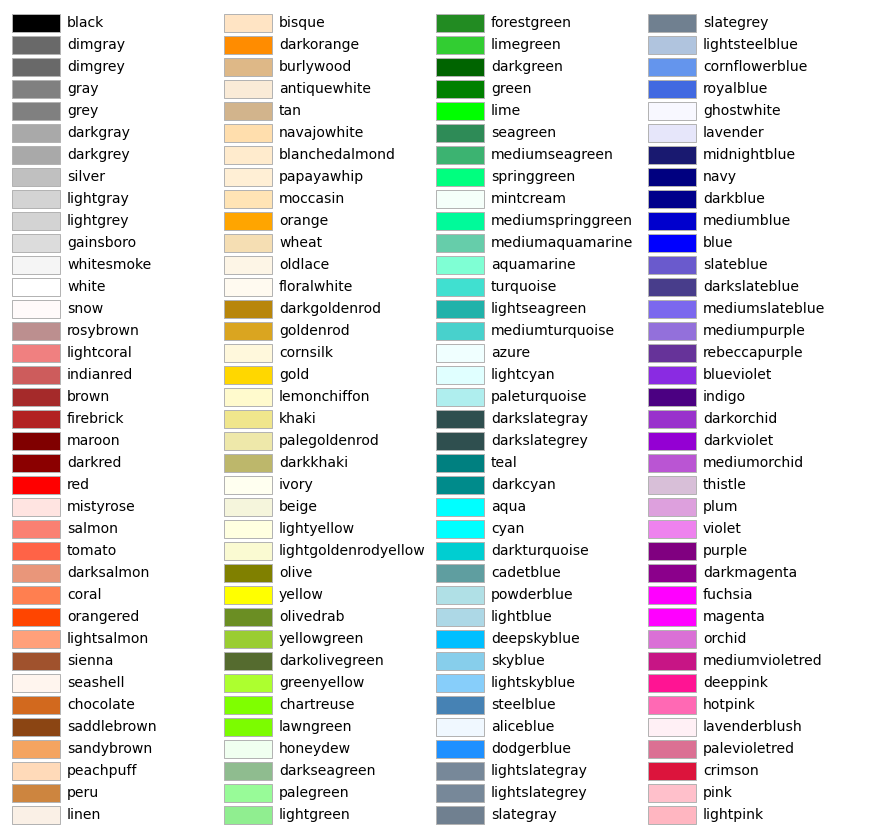
CSS 색상 #
plot_colortable(mcolors.CSS4_COLORS)
plt.show()
XKCD 색상 #
XKCD 색상이 지원되지만 큰 그림을 생성하므로 지금은 건너뜁니다. 원하는 경우 다음 코드를 사용할 수 있습니다.
xkcd_fig = plot_colortable(mcolors.XKCD_COLORS, "XKCD Colors")
xkcd_fig.savefig("XKCD_Colors.png")
참조
다음 함수, 메서드, 클래스 및 모듈의 사용이 이 예제에 표시됩니다.
스크립트의 총 실행 시간: (0분 1.530초)