메모
전체 예제 코드를 다운로드 하려면 여기 를 클릭 하십시오.
히스토그램(hist) 함수의 일부 기능 #
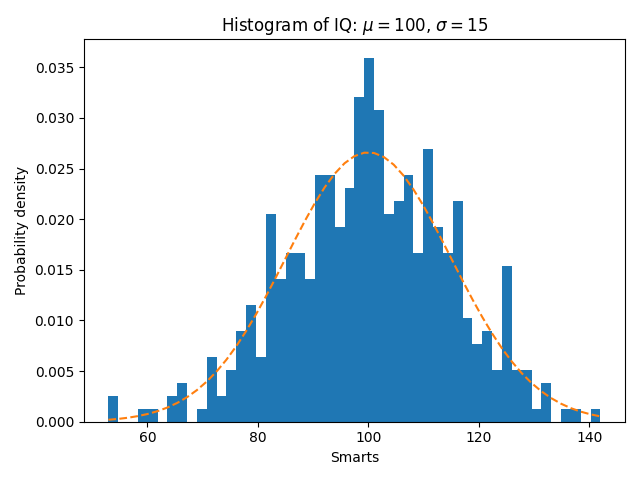
기본 히스토그램 외에도 이 데모는 몇 가지 선택적 기능을 보여줍니다.
데이터 빈 수 설정.
히스토그램의 적분이 1이 되도록 빈 높이를 정규화 하는 밀도 매개변수. 결과 히스토그램은 확률 밀도 함수의 근사치입니다.
다른 Bin 도수와 크기를 선택하면 히스토그램의 모양에 상당한 영향을 미칠 수 있습니다. Astropy 문서에는 이러한 매개변수를 선택하는 방법에 대한 훌륭한 섹션 이 있습니다.
import numpy as np
import matplotlib.pyplot as plt

np.random.seed(19680801)

# example data
mu = 100  # mean of distribution
sigma = 15  # standard deviation of distribution
x = mu + sigma * np.random.randn(437)

num_bins = 50

fig, ax = plt.subplots()

# the histogram of the data
n, bins, patches = ax.hist(x, num_bins, density=True)

# add a 'best fit' line
y = ((1 / (np.sqrt(2 * np.pi) * sigma)) *
     np.exp(-0.5 * (1 / sigma * (bins - mu))**2))
ax.plot(bins, y, '--')
ax.set_xlabel('Smarts')
ax.set_ylabel('Probability density')
ax.set_title(r'Histogram of IQ: $\mu=100$, $\sigma=15$')

# Tweak spacing to prevent clipping of ylabel
fig.tight_layout()
plt.show()

참조
다음 함수, 메서드, 클래스 및 모듈의 사용이 이 예제에 표시됩니다.