메모
전체 예제 코드를 다운로드 하려면 여기 를 클릭 하십시오.
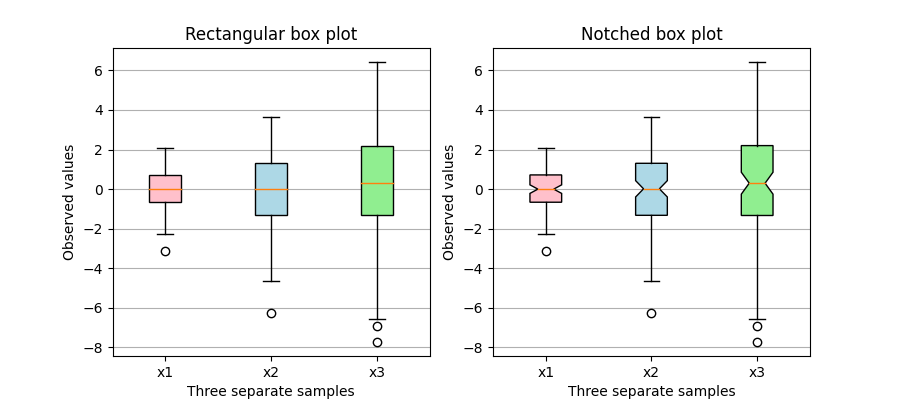
사용자 지정 채우기 색상이 있는 박스 플롯 #
이 플롯은 두 가지 유형의 박스 플롯(직사각형 및 노치)을 만드는 방법과 박스 플롯 아티스트의 속성에 액세스하여 사용자 정의 색상으로 채우는 방법을 보여줍니다. 또한 이 labels매개변수는 각 샘플에 대한 x-tick 레이블을 제공하는 데 사용됩니다.
boxplots 및 그 역사에 대한 좋은 일반 참조는 여기에서 찾을 수 있습니다: http://vita.had.co.nz/papers/boxplots.pdf
import matplotlib.pyplot as plt
import numpy as np

# Random test data
np.random.seed(19680801)
all_data = [np.random.normal(0, std, size=100) for std in range(1, 4)]
labels = ['x1', 'x2', 'x3']

fig, (ax1, ax2) = plt.subplots(nrows=1, ncols=2, figsize=(9, 4))

# rectangular box plot
bplot1 = ax1.boxplot(all_data,
                     vert=True,  # vertical box alignment
                     patch_artist=True,  # fill with color
                     labels=labels)  # will be used to label x-ticks
ax1.set_title('Rectangular box plot')

# notch shape box plot
bplot2 = ax2.boxplot(all_data,
                     notch=True,  # notch shape
                     vert=True,  # vertical box alignment
                     patch_artist=True,  # fill with color
                     labels=labels)  # will be used to label x-ticks
ax2.set_title('Notched box plot')

# fill with colors
colors = ['pink', 'lightblue', 'lightgreen']
for bplot in (bplot1, bplot2):
    for patch, color in zip(bplot['boxes'], colors):
        patch.set_facecolor(color)

# adding horizontal grid lines
for ax in [ax1, ax2]:
    ax.yaxis.grid(True)
    ax.set_xlabel('Three separate samples')
    ax.set_ylabel('Observed values')

plt.show()