메모
전체 예제 코드를 다운로드 하려면 여기 를 클릭 하십시오.
GridSpec 데모 #
이 예제는 서브플롯을 생성하기 위해 를 사용하는 방법 , width_ratios 및
height_ratiosGridSpec 를 사용하여 서브 플롯의 상대 크기 제어, 서브플롯 매개변수( left , right , bottom , top , wspace 및
hspace ) 를 사용하여 서브플롯 주변 및 서브플롯 사이의 간격 제어를 보여 줍니다. .
import matplotlib.pyplot as plt
from matplotlib.gridspec import GridSpec


def annotate_axes(fig):
    for i, ax in enumerate(fig.axes):
        ax.text(0.5, 0.5, "ax%d" % (i+1), va="center", ha="center")
        ax.tick_params(labelbottom=False, labelleft=False)


fig = plt.figure()
fig.suptitle("Controlling subplot sizes with width_ratios and height_ratios")

gs = GridSpec(2, 2, width_ratios=[1, 2], height_ratios=[4, 1])
ax1 = fig.add_subplot(gs[0])
ax2 = fig.add_subplot(gs[1])
ax3 = fig.add_subplot(gs[2])
ax4 = fig.add_subplot(gs[3])

annotate_axes(fig)
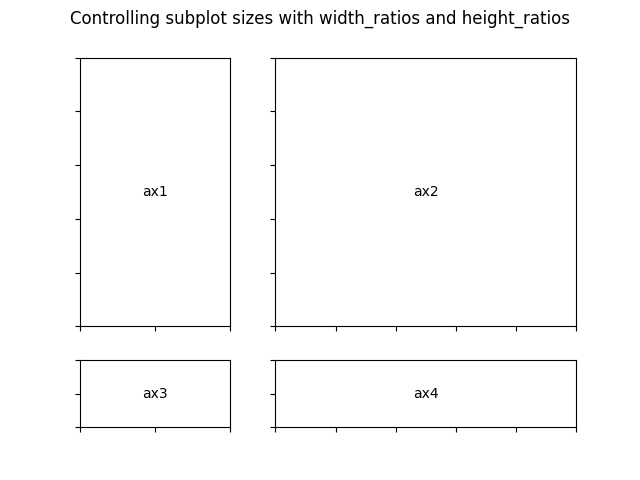
fig = plt.figure()
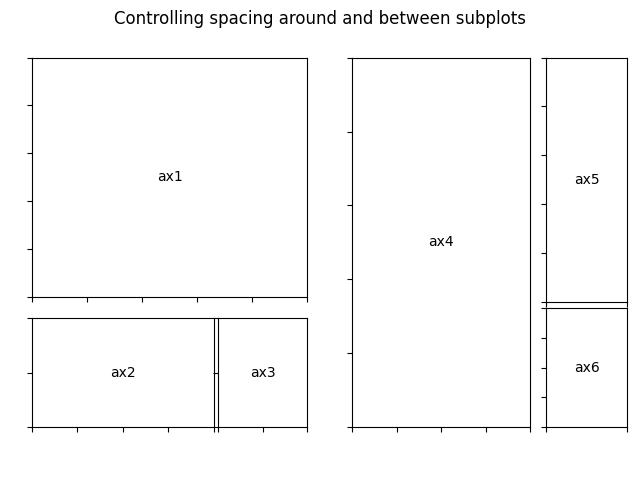
fig.suptitle("Controlling spacing around and between subplots")
gs1 = GridSpec(3, 3, left=0.05, right=0.48, wspace=0.05)
ax1 = fig.add_subplot(gs1[:-1, :])
ax2 = fig.add_subplot(gs1[-1, :-1])
ax3 = fig.add_subplot(gs1[-1, -1])
gs2 = GridSpec(3, 3, left=0.55, right=0.98, hspace=0.05)
ax4 = fig.add_subplot(gs2[:, :-1])
ax5 = fig.add_subplot(gs2[:-1, -1])
ax6 = fig.add_subplot(gs2[-1, -1])
annotate_axes(fig)
plt.show()