메모
전체 예제 코드를 다운로드 하려면 여기 를 클릭 하십시오.
타원 컬렉션 #
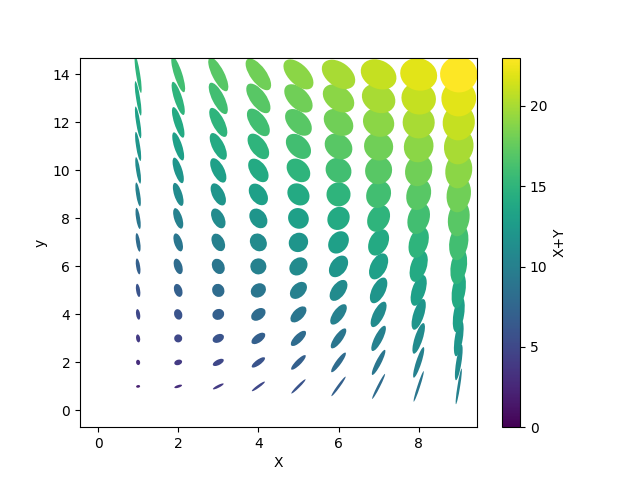
타원 모음 그리기. EllipseCollection이것은 a 또는 를 사용하여 동일하게 가능하지만 PathCollectionan 을 EllipseCollection사용하면 훨씬 더 짧은 코드를 사용할 수 있습니다.
import matplotlib.pyplot as plt
import numpy as np
from matplotlib.collections import EllipseCollection

x = np.arange(10)
y = np.arange(15)
X, Y = np.meshgrid(x, y)

XY = np.column_stack((X.ravel(), Y.ravel()))

ww = X / 10.0
hh = Y / 15.0
aa = X * 9


fig, ax = plt.subplots()

ec = EllipseCollection(ww, hh, aa, units='x', offsets=XY,
                       offset_transform=ax.transData)
ec.set_array((X + Y).ravel())
ax.add_collection(ec)
ax.autoscale_view()
ax.set_xlabel('X')
ax.set_ylabel('y')
cbar = plt.colorbar(ec)
cbar.set_label('X+Y')
plt.show()

참조
다음 함수, 메서드, 클래스 및 모듈의 사용이 이 예제에 표시됩니다.