메모
전체 예제 코드를 다운로드 하려면 여기 를 클릭 하십시오.
스트림플롯 #
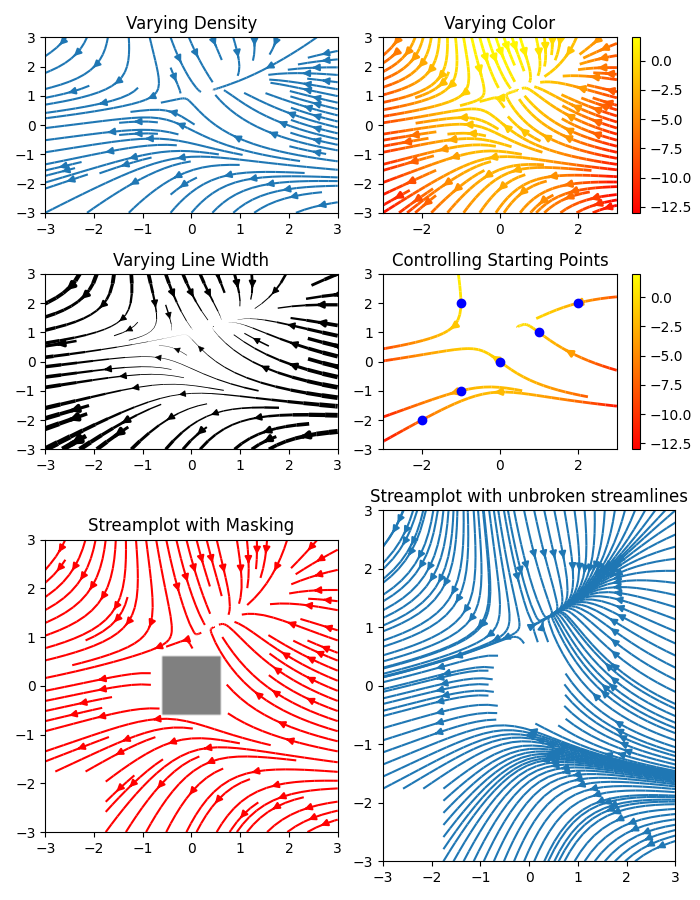
스트림 플롯 또는 유선 플롯은 2D 벡터 필드를 표시하는 데 사용됩니다. 이 예는 함수의 몇 가지 기능을 보여줍니다 streamplot.
유선형을 따라 색상을 변경합니다.
유선의 밀도 변화.
유선형을 따라 선 너비를 변경합니다.
유선의 시작점을 제어합니다.
마스킹된 영역 및 NaN 값 건너뛰기를 간소화합니다.
단일 그리드 셀 내에서 선의 한계를 초과하더라도 끊어지지 않는 유선형.
import numpy as np
import matplotlib.pyplot as plt


w = 3
Y, X = np.mgrid[-w:w:100j, -w:w:100j]
U = -1 - X**2 + Y
V = 1 + X - Y**2
speed = np.sqrt(U**2 + V**2)

fig, axs = plt.subplots(3, 2, figsize=(7, 9), height_ratios=[1, 1, 2])
axs = axs.flat

#  Varying density along a streamline
axs[0].streamplot(X, Y, U, V, density=[0.5, 1])
axs[0].set_title('Varying Density')

# Varying color along a streamline
strm = axs[1].streamplot(X, Y, U, V, color=U, linewidth=2, cmap='autumn')
fig.colorbar(strm.lines)
axs[1].set_title('Varying Color')

#  Varying line width along a streamline
lw = 5*speed / speed.max()
axs[2].streamplot(X, Y, U, V, density=0.6, color='k', linewidth=lw)
axs[2].set_title('Varying Line Width')

# Controlling the starting points of the streamlines
seed_points = np.array([[-2, -1, 0, 1, 2, -1], [-2, -1,  0, 1, 2, 2]])

strm = axs[3].streamplot(X, Y, U, V, color=U, linewidth=2,
                         cmap='autumn', start_points=seed_points.T)
fig.colorbar(strm.lines)
axs[3].set_title('Controlling Starting Points')

# Displaying the starting points with blue symbols.
axs[3].plot(seed_points[0], seed_points[1], 'bo')
axs[3].set(xlim=(-w, w), ylim=(-w, w))

# Create a mask
mask = np.zeros(U.shape, dtype=bool)
mask[40:60, 40:60] = True
U[:20, :20] = np.nan
U = np.ma.array(U, mask=mask)

axs[4].streamplot(X, Y, U, V, color='r')
axs[4].set_title('Streamplot with Masking')

axs[4].imshow(~mask, extent=(-w, w, -w, w), alpha=0.5, cmap='gray',
              aspect='auto')
axs[4].set_aspect('equal')

axs[5].streamplot(X, Y, U, V, broken_streamlines=False)
axs[5].set_title('Streamplot with unbroken streamlines')

plt.tight_layout()
plt.show()

참조
다음 함수, 메서드, 클래스 및 모듈의 사용이 이 예제에 표시됩니다.
스크립트의 총 실행 시간: (0분 4.076초)