메모
전체 예제 코드를 다운로드 하려면 여기 를 클릭 하십시오.
데이터 브라우저 #
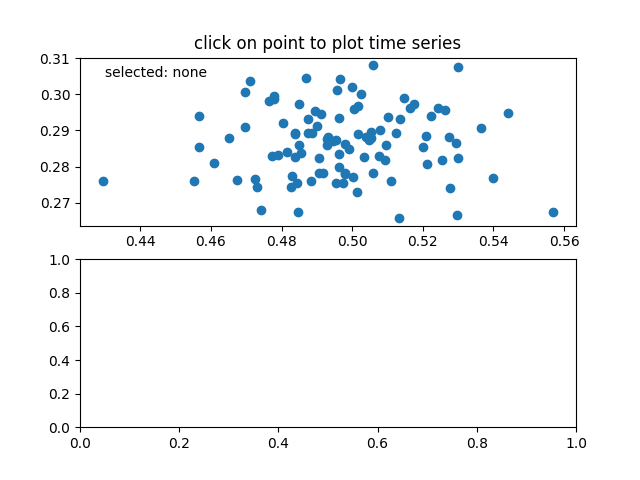
여러 캔버스 간에 데이터를 연결합니다.
이 예제에서는 데이터를 여러 캔버스와 상호 작용하는 방법을 다룹니다. 이렇게 하면 한 축에서 점을 선택하고 강조 표시하고 다른 축에서 해당 점의 데이터를 생성할 수 있습니다.
메모
이 예제는 Matplotlib의 대화형 기능을 실행하며 정적 문서에는 나타나지 않습니다. 상호 작용을 보려면 컴퓨터에서 이 코드를 실행하십시오.
개별 부분을 복사하여 붙여넣거나 페이지 하단의 링크를 사용하여 전체 예제를 다운로드할 수 있습니다.

import numpy as np


class PointBrowser:
    """
    Click on a point to select and highlight it -- the data that
    generated the point will be shown in the lower axes.  Use the 'n'
    and 'p' keys to browse through the next and previous points
    """

    def __init__(self):
        self.lastind = 0

        self.text = ax.text(0.05, 0.95, 'selected: none',
                            transform=ax.transAxes, va='top')
        self.selected, = ax.plot([xs[0]], [ys[0]], 'o', ms=12, alpha=0.4,
                                 color='yellow', visible=False)

    def on_press(self, event):
        if self.lastind is None:
            return
        if event.key not in ('n', 'p'):
            return
        if event.key == 'n':
            inc = 1
        else:
            inc = -1

        self.lastind += inc
        self.lastind = np.clip(self.lastind, 0, len(xs) - 1)
        self.update()

    def on_pick(self, event):

        if event.artist != line:
            return True

        N = len(event.ind)
        if not N:
            return True

        # the click locations
        x = event.mouseevent.xdata
        y = event.mouseevent.ydata

        distances = np.hypot(x - xs[event.ind], y - ys[event.ind])
        indmin = distances.argmin()
        dataind = event.ind[indmin]

        self.lastind = dataind
        self.update()

    def update(self):
        if self.lastind is None:
            return

        dataind = self.lastind

        ax2.clear()
        ax2.plot(X[dataind])

        ax2.text(0.05, 0.9, f'mu={xs[dataind]:1.3f}\nsigma={ys[dataind]:1.3f}',
                 transform=ax2.transAxes, va='top')
        ax2.set_ylim(-0.5, 1.5)
        self.selected.set_visible(True)
        self.selected.set_data(xs[dataind], ys[dataind])

        self.text.set_text('selected: %d' % dataind)
        fig.canvas.draw()


if __name__ == '__main__':
    import matplotlib.pyplot as plt
    # Fixing random state for reproducibility
    np.random.seed(19680801)

    X = np.random.rand(100, 200)
    xs = np.mean(X, axis=1)
    ys = np.std(X, axis=1)

    fig, (ax, ax2) = plt.subplots(2, 1)
    ax.set_title('click on point to plot time series')
    line, = ax.plot(xs, ys, 'o', picker=True, pickradius=5)

    browser = PointBrowser()

    fig.canvas.mpl_connect('pick_event', browser.on_pick)
    fig.canvas.mpl_connect('key_press_event', browser.on_press)

    plt.show()