메모
전체 예제 코드를 다운로드 하려면 여기 를 클릭 하십시오.
타이트한 레이아웃으로 축 크기 조정 #
tight_layout축 개체와 축의 레이블 간에 겹치지 않도록 Figure의 서브플롯 크기를 조정하려고 시도합니다.
자세한 내용은 타이트 레이아웃 가이드 를 참조 하고 대안은 Constrained Layout 가이드 를 참조하세요.
import matplotlib.pyplot as plt
import itertools
import warnings


fontsizes = itertools.cycle([8, 16, 24, 32])


def example_plot(ax):
    ax.plot([1, 2])
    ax.set_xlabel('x-label', fontsize=next(fontsizes))
    ax.set_ylabel('y-label', fontsize=next(fontsizes))
    ax.set_title('Title', fontsize=next(fontsizes))
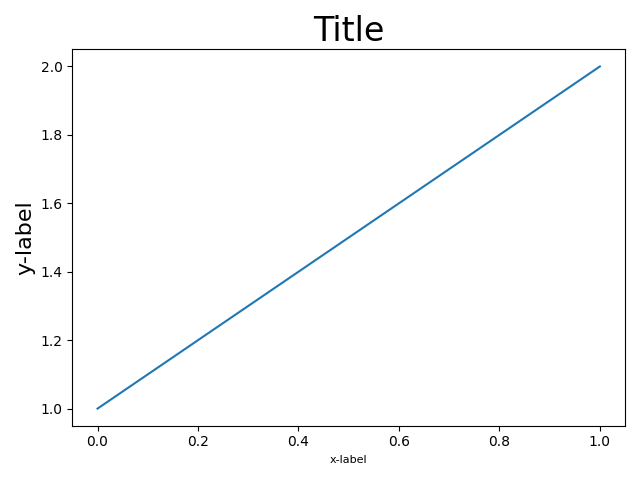
fig, ax = plt.subplots()
example_plot(ax)
fig.tight_layout()
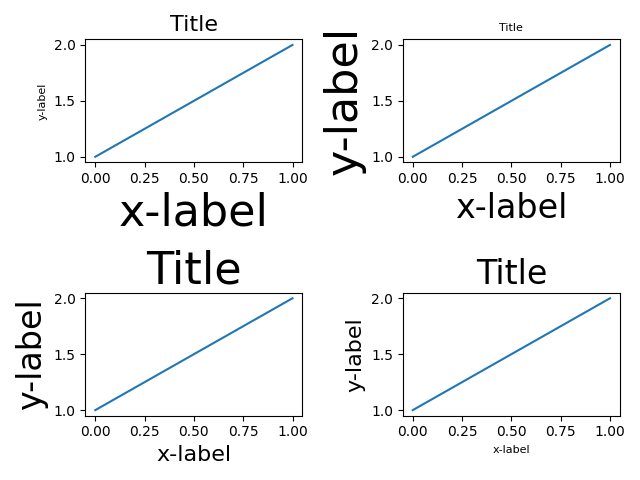
fig, ((ax1, ax2), (ax3, ax4)) = plt.subplots(nrows=2, ncols=2)
example_plot(ax1)
example_plot(ax2)
example_plot(ax3)
example_plot(ax4)
fig.tight_layout()
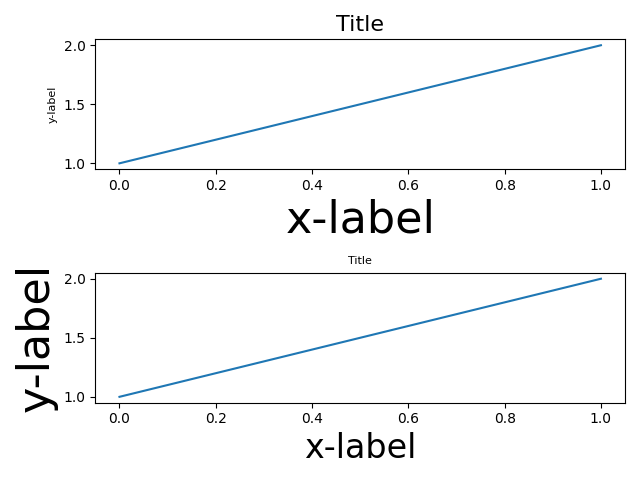
fig, (ax1, ax2) = plt.subplots(nrows=2, ncols=1)
example_plot(ax1)
example_plot(ax2)
fig.tight_layout()
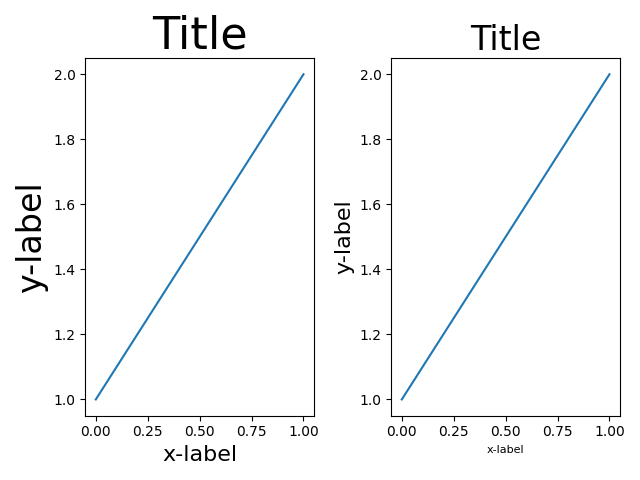
fig, (ax1, ax2) = plt.subplots(nrows=1, ncols=2)
example_plot(ax1)
example_plot(ax2)
fig.tight_layout()
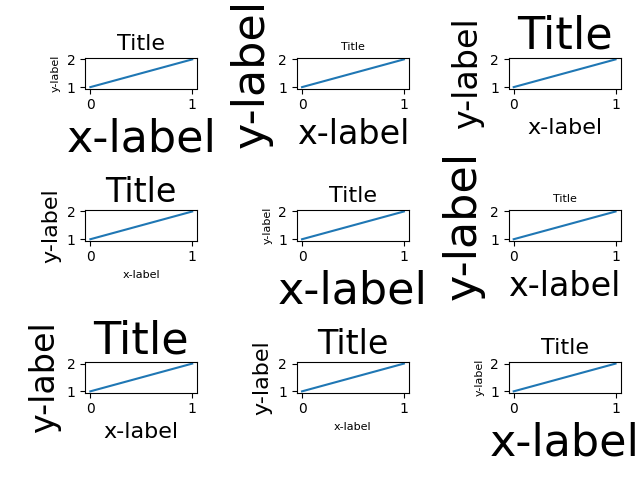
fig, axs = plt.subplots(nrows=3, ncols=3)
for ax in axs.flat:
    example_plot(ax)
fig.tight_layout()
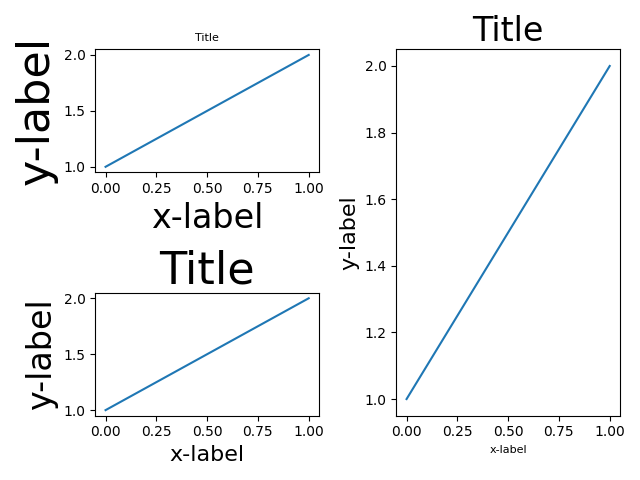
plt.figure()
ax1 = plt.subplot(221)
ax2 = plt.subplot(223)
ax3 = plt.subplot(122)
example_plot(ax1)
example_plot(ax2)
example_plot(ax3)
plt.tight_layout()
plt.figure()
ax1 = plt.subplot2grid((3, 3), (0, 0))
ax2 = plt.subplot2grid((3, 3), (0, 1), colspan=2)
ax3 = plt.subplot2grid((3, 3), (1, 0), colspan=2, rowspan=2)
ax4 = plt.subplot2grid((3, 3), (1, 2), rowspan=2)
example_plot(ax1)
example_plot(ax2)
example_plot(ax3)
example_plot(ax4)
plt.tight_layout()
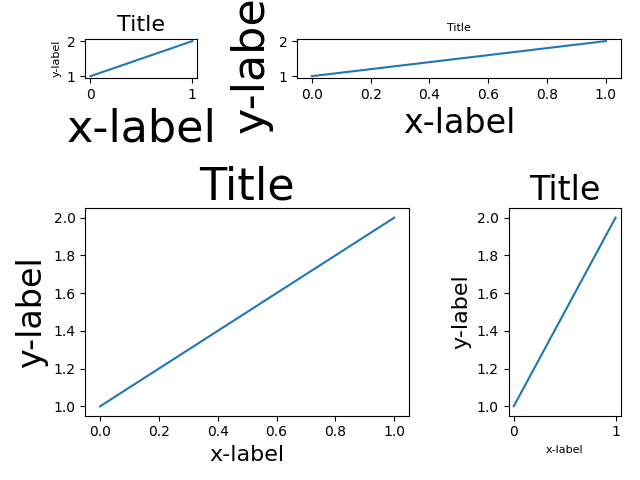
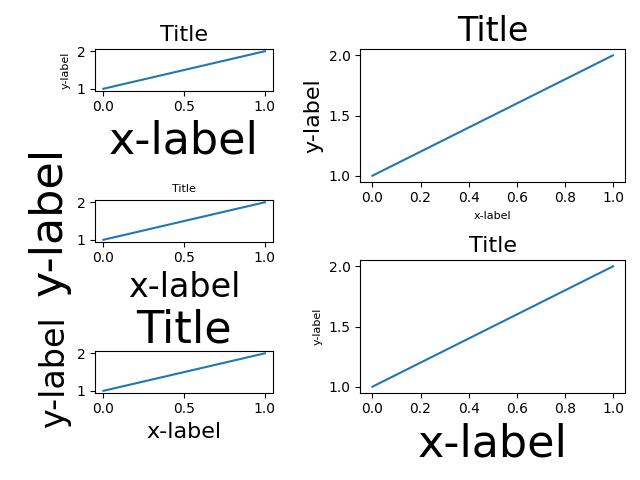
fig = plt.figure()

gs1 = fig.add_gridspec(3, 1)
ax1 = fig.add_subplot(gs1[0])
ax2 = fig.add_subplot(gs1[1])
ax3 = fig.add_subplot(gs1[2])
example_plot(ax1)
example_plot(ax2)
example_plot(ax3)
gs1.tight_layout(fig, rect=[None, None, 0.45, None])

gs2 = fig.add_gridspec(2, 1)
ax4 = fig.add_subplot(gs2[0])
ax5 = fig.add_subplot(gs2[1])
example_plot(ax4)
example_plot(ax5)
with warnings.catch_warnings():
    # gs2.tight_layout cannot handle the subplots from the first gridspec
    # (gs1), so it will raise a warning. We are going to match the gridspecs
    # manually so we can filter the warning away.
    warnings.simplefilter("ignore", UserWarning)
    gs2.tight_layout(fig, rect=[0.45, None, None, None])

# now match the top and bottom of two gridspecs.
top = min(gs1.top, gs2.top)
bottom = max(gs1.bottom, gs2.bottom)

gs1.update(top=top, bottom=bottom)
gs2.update(top=top, bottom=bottom)

plt.show()
참조
다음 함수, 메서드, 클래스 및 모듈의 사용이 이 예제에 표시됩니다.
스크립트의 총 실행 시간: (0분 4.973초)