메모
전체 예제 코드를 다운로드 하려면 여기 를 클릭 하십시오.
단순 고정 아티스트 #
이 예제는
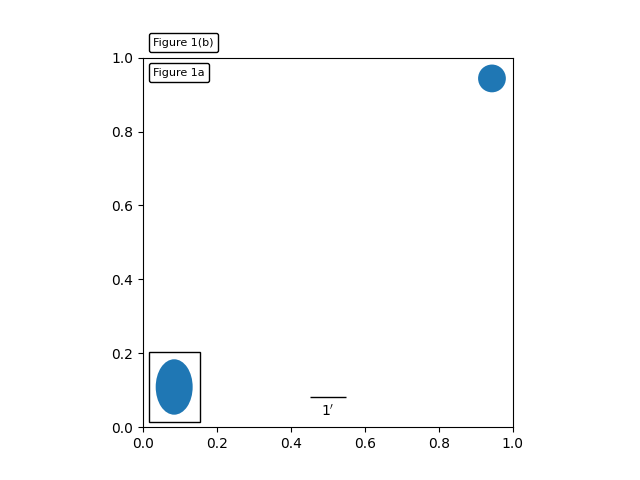
matplotlib.offsetbox및 에 있는 고정된 도우미 클래스의 사용을 보여줍니다 mpl_toolkits.axes_grid1. 툴킷을 사용하지 않는 유사한 그림의 구현은 Anchored Artists 에서 찾을 수 있습니다 .

import matplotlib.pyplot as plt


def draw_text(ax):
    """
    Draw two text-boxes, anchored by different corners to the upper-left
    corner of the figure.
    """
    from matplotlib.offsetbox import AnchoredText
    at = AnchoredText("Figure 1a",
                      loc='upper left', prop=dict(size=8), frameon=True,
                      )
    at.patch.set_boxstyle("round,pad=0.,rounding_size=0.2")
    ax.add_artist(at)

    at2 = AnchoredText("Figure 1(b)",
                       loc='lower left', prop=dict(size=8), frameon=True,
                       bbox_to_anchor=(0., 1.),
                       bbox_transform=ax.transAxes
                       )
    at2.patch.set_boxstyle("round,pad=0.,rounding_size=0.2")
    ax.add_artist(at2)


def draw_circle(ax):
    """
    Draw a circle in axis coordinates
    """
    from mpl_toolkits.axes_grid1.anchored_artists import AnchoredDrawingArea
    from matplotlib.patches import Circle
    ada = AnchoredDrawingArea(20, 20, 0, 0,
                              loc='upper right', pad=0., frameon=False)
    p = Circle((10, 10), 10)
    ada.da.add_artist(p)
    ax.add_artist(ada)


def draw_ellipse(ax):
    """
    Draw an ellipse of width=0.1, height=0.15 in data coordinates
    """
    from mpl_toolkits.axes_grid1.anchored_artists import AnchoredEllipse
    ae = AnchoredEllipse(ax.transData, width=0.1, height=0.15, angle=0.,
                         loc='lower left', pad=0.5, borderpad=0.4,
                         frameon=True)

    ax.add_artist(ae)


def draw_sizebar(ax):
    """
    Draw a horizontal bar with length of 0.1 in data coordinates,
    with a fixed label underneath.
    """
    from mpl_toolkits.axes_grid1.anchored_artists import AnchoredSizeBar
    asb = AnchoredSizeBar(ax.transData,
                          0.1,
                          r"1$^{\prime}$",
                          loc='lower center',
                          pad=0.1, borderpad=0.5, sep=5,
                          frameon=False)
    ax.add_artist(asb)


fig, ax = plt.subplots()
ax.set_aspect(1.)

draw_text(ax)
draw_circle(ax)
draw_ellipse(ax)
draw_sizebar(ax)

plt.show()