메모
전체 예제 코드를 다운로드 하려면 여기 를 클릭 하십시오.
다중 커서 #
여러 플롯에 동시에 커서를 표시합니다.
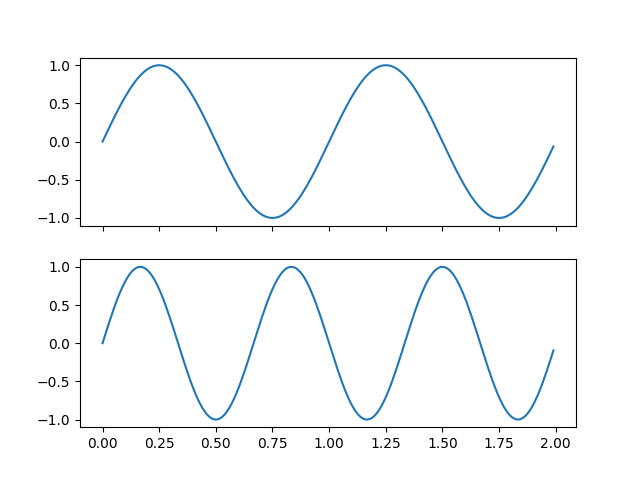
이 예에서는 두 개의 서로 다른 그림으로 분할된 세 개의 축을 생성합니다. 한 서브플롯의 데이터 위에 커서를 놓으면 해당 데이터 포인트의 값이 모든 축에 표시됩니다.
import numpy as np
import matplotlib.pyplot as plt
from matplotlib.widgets import MultiCursor
t = np.arange(0.0, 2.0, 0.01)
s1 = np.sin(2*np.pi*t)
s2 = np.sin(3*np.pi*t)
s3 = np.sin(4*np.pi*t)
fig, (ax1, ax2) = plt.subplots(2, sharex=True)
ax1.plot(t, s1)
ax2.plot(t, s2)
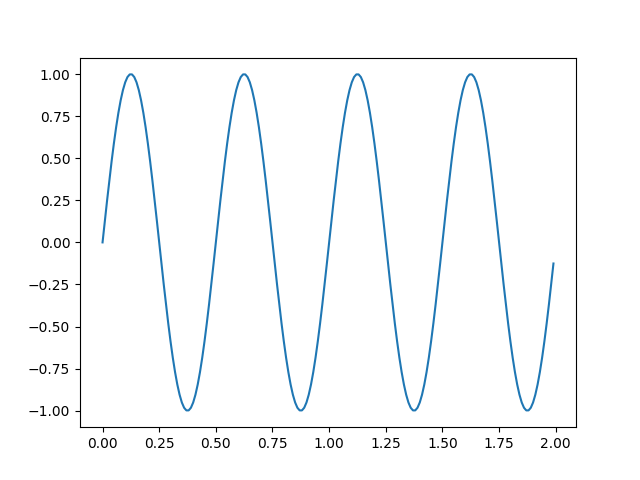
fig, ax3 = plt.subplots()
ax3.plot(t, s3)
multi = MultiCursor(None, (ax1, ax2, ax3), color='r', lw=1)
plt.show()