메모
전체 예제 코드를 다운로드 하려면 여기 를 클릭 하십시오.
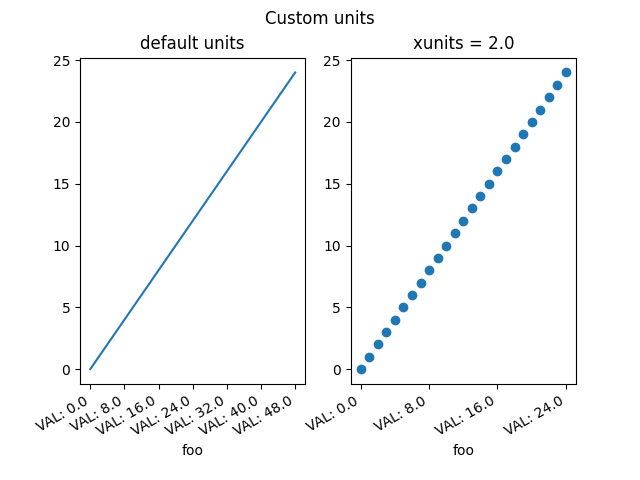
에반스 테스트 #
"단위"에 따라 변환 및 다른 눈금 형식을 지원하는 모형 "Foo" 단위 클래스. 여기서 "단위"는 스칼라 변환 계수일 뿐이지만 이 예제는 Matplotlib가 클라이언트 패키지가 사용하는 단위 종류에 대해 완전히 독립적임을 보여줍니다.
import numpy as np

import matplotlib.units as units
import matplotlib.ticker as ticker
import matplotlib.pyplot as plt


class Foo:
    def __init__(self, val, unit=1.0):
        self.unit = unit
        self._val = val * unit

    def value(self, unit):
        if unit is None:
            unit = self.unit
        return self._val / unit


class FooConverter(units.ConversionInterface):
    @staticmethod
    def axisinfo(unit, axis):
        """Return the Foo AxisInfo."""
        if unit == 1.0 or unit == 2.0:
            return units.AxisInfo(
                majloc=ticker.IndexLocator(8, 0),
                majfmt=ticker.FormatStrFormatter("VAL: %s"),
                label='foo',
                )

        else:
            return None

    @staticmethod
    def convert(obj, unit, axis):
        """
        Convert *obj* using *unit*.

        If *obj* is a sequence, return the converted sequence.
        """
        if np.iterable(obj):
            return [o.value(unit) for o in obj]
        else:
            return obj.value(unit)

    @staticmethod
    def default_units(x, axis):
        """Return the default unit for *x* or None."""
        if np.iterable(x):
            for thisx in x:
                return thisx.unit
        else:
            return x.unit


units.registry[Foo] = FooConverter()

# create some Foos
x = [Foo(val, 1.0) for val in range(0, 50, 2)]
# and some arbitrary y data
y = [i for i in range(len(x))]

fig, (ax1, ax2) = plt.subplots(1, 2)
fig.suptitle("Custom units")
fig.subplots_adjust(bottom=0.2)

# plot specifying units
ax2.plot(x, y, 'o', xunits=2.0)
ax2.set_title("xunits = 2.0")
plt.setp(ax2.get_xticklabels(), rotation=30, ha='right')

# plot without specifying units; will use the None branch for axisinfo
ax1.plot(x, y)  # uses default units
ax1.set_title('default units')
plt.setp(ax1.get_xticklabels(), rotation=30, ha='right')

plt.show()