메모
전체 예제 코드를 다운로드 하려면 여기 를 클릭 하십시오.
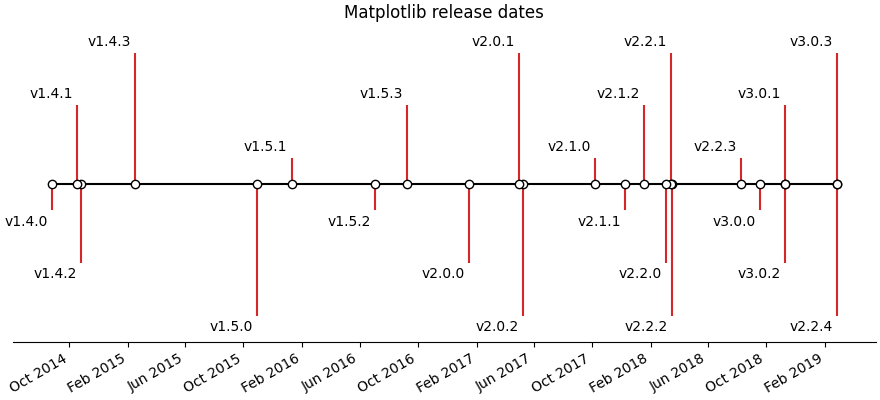
라인, 날짜, 텍스트로 타임라인 만들기 #
Matplotlib 릴리스 날짜를 사용하여 간단한 타임라인을 만드는 방법.
날짜와 텍스트 모음으로 타임라인을 만들 수 있습니다. 이 예에서는 Matplotlib의 최신 릴리스 날짜를 사용하여 간단한 타임라인을 만드는 방법을 보여줍니다. 먼저 GitHub에서 데이터를 가져옵니다.
import matplotlib.pyplot as plt
import numpy as np
import matplotlib.dates as mdates
from datetime import datetime

try:
    # Try to fetch a list of Matplotlib releases and their dates
    # from https://api.github.com/repos/matplotlib/matplotlib/releases
    import urllib.request
    import json

    url = 'https://api.github.com/repos/matplotlib/matplotlib/releases'
    url += '?per_page=100'
    data = json.loads(urllib.request.urlopen(url, timeout=.4).read().decode())

    dates = []
    names = []
    for item in data:
        if 'rc' not in item['tag_name'] and 'b' not in item['tag_name']:
            dates.append(item['published_at'].split("T")[0])
            names.append(item['tag_name'])
    # Convert date strings (e.g. 2014-10-18) to datetime
    dates = [datetime.strptime(d, "%Y-%m-%d") for d in dates]

except Exception:
    # In case the above fails, e.g. because of missing internet connection
    # use the following lists as fallback.
    names = ['v2.2.4', 'v3.0.3', 'v3.0.2', 'v3.0.1', 'v3.0.0', 'v2.2.3',
             'v2.2.2', 'v2.2.1', 'v2.2.0', 'v2.1.2', 'v2.1.1', 'v2.1.0',
             'v2.0.2', 'v2.0.1', 'v2.0.0', 'v1.5.3', 'v1.5.2', 'v1.5.1',
             'v1.5.0', 'v1.4.3', 'v1.4.2', 'v1.4.1', 'v1.4.0']

    dates = ['2019-02-26', '2019-02-26', '2018-11-10', '2018-11-10',
             '2018-09-18', '2018-08-10', '2018-03-17', '2018-03-16',
             '2018-03-06', '2018-01-18', '2017-12-10', '2017-10-07',
             '2017-05-10', '2017-05-02', '2017-01-17', '2016-09-09',
             '2016-07-03', '2016-01-10', '2015-10-29', '2015-02-16',
             '2014-10-26', '2014-10-18', '2014-08-26']

    # Convert date strings (e.g. 2014-10-18) to datetime
    dates = [datetime.strptime(d, "%Y-%m-%d") for d in dates]
다음으로 가까운 이벤트도 구별하기 위해 약간의 수준 변화가 있는 스템 플롯을 만듭니다. 타임라인의 1차원적 특성을 시각적으로 강조하기 위해 기준선에 마커를 추가합니다.
각 이벤트에 대해 를 통해 텍스트 레이블을 추가합니다. 이 레이블 annotate은 이벤트 라인의 끝에서 포인트 단위로 오프셋됩니다.
Matplotlib는 날짜/시간 입력을 자동으로 플로팅합니다.
# Choose some nice levels
levels = np.tile([-5, 5, -3, 3, -1, 1],
                 int(np.ceil(len(dates)/6)))[:len(dates)]

# Create figure and plot a stem plot with the date
fig, ax = plt.subplots(figsize=(8.8, 4), constrained_layout=True)
ax.set(title="Matplotlib release dates")

ax.vlines(dates, 0, levels, color="tab:red")  # The vertical stems.
ax.plot(dates, np.zeros_like(dates), "-o",
        color="k", markerfacecolor="w")  # Baseline and markers on it.

# annotate lines
for d, l, r in zip(dates, levels, names):
    ax.annotate(r, xy=(d, l),
                xytext=(-3, np.sign(l)*3), textcoords="offset points",
                horizontalalignment="right",
                verticalalignment="bottom" if l > 0 else "top")

# format xaxis with 4 month intervals
ax.xaxis.set_major_locator(mdates.MonthLocator(interval=4))
ax.xaxis.set_major_formatter(mdates.DateFormatter("%b %Y"))
plt.setp(ax.get_xticklabels(), rotation=30, ha="right")

# remove y axis and spines
ax.yaxis.set_visible(False)
ax.spines[["left", "top", "right"]].set_visible(False)

ax.margins(y=0.1)
plt.show()
참조
다음 함수, 메서드, 클래스 및 모듈의 사용이 이 예제에 표시됩니다.
스크립트의 총 실행 시간: ( 0분 1.168초)