메모
전체 예제 코드를 다운로드 하려면 여기 를 클릭 하십시오.
컬러바 배치 #
컬러바는 이미지 데이터의 정량적 범위를 나타냅니다. 피규어를 배치하는 것은 그들을 위한 공간이 필요하기 때문에 사소한 일이 아닙니다.
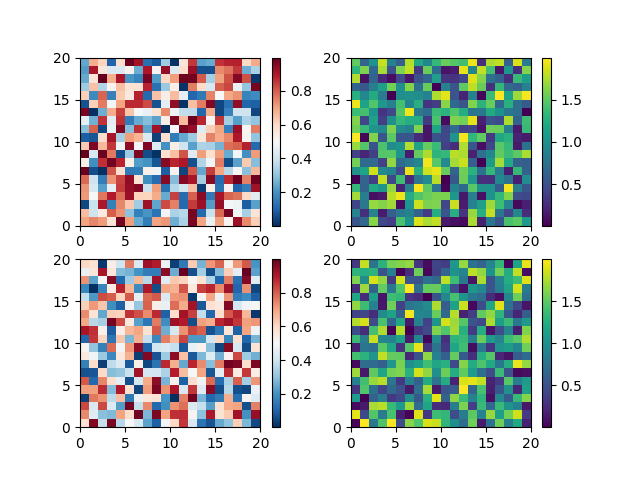
가장 간단한 경우는 색상 막대를 각 축에 연결하는 것입니다.
import matplotlib.pyplot as plt
import numpy as np


# Fixing random state for reproducibility
np.random.seed(19680801)

fig, axs = plt.subplots(2, 2)
cmaps = ['RdBu_r', 'viridis']
for col in range(2):
    for row in range(2):
        ax = axs[row, col]
        pcm = ax.pcolormesh(np.random.random((20, 20)) * (col + 1),
                            cmap=cmaps[col])
        fig.colorbar(pcm, ax=ax)
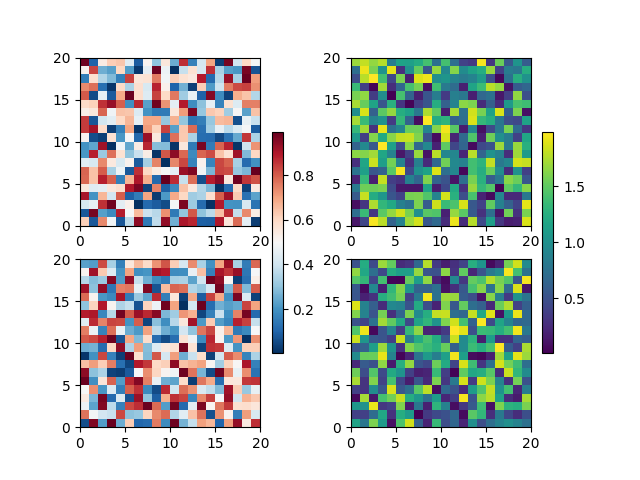
첫 번째 열은 두 행에서 동일한 유형의 데이터를 가지므로
Figure.colorbar단일 축 대신 축 목록을 호출하여 수행하는 컬러바를 결합하는 것이 바람직할 수 있습니다.
fig, axs = plt.subplots(2, 2)
cmaps = ['RdBu_r', 'viridis']
for col in range(2):
    for row in range(2):
        ax = axs[row, col]
        pcm = ax.pcolormesh(np.random.random((20, 20)) * (col + 1),
                            cmap=cmaps[col])
    fig.colorbar(pcm, ax=axs[:, col], shrink=0.6)
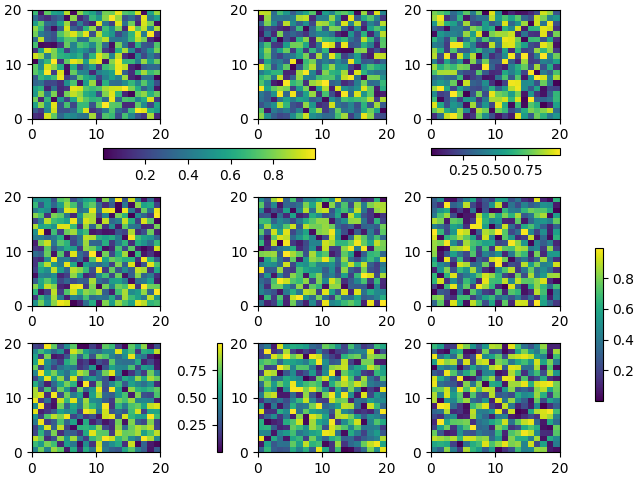
비교적 복잡한 컬러바 레이아웃은 이 패러다임을 사용하여 가능합니다. 이 예는
constrained_layout=True
fig, axs = plt.subplots(3, 3, constrained_layout=True)
for ax in axs.flat:
    pcm = ax.pcolormesh(np.random.random((20, 20)))

fig.colorbar(pcm, ax=axs[0, :2], shrink=0.6, location='bottom')
fig.colorbar(pcm, ax=[axs[0, 2]], location='bottom')
fig.colorbar(pcm, ax=axs[1:, :], location='right', shrink=0.6)
fig.colorbar(pcm, ax=[axs[2, 1]], location='left')
<matplotlib.colorbar.Colorbar object at 0x7f2cfb43f070>
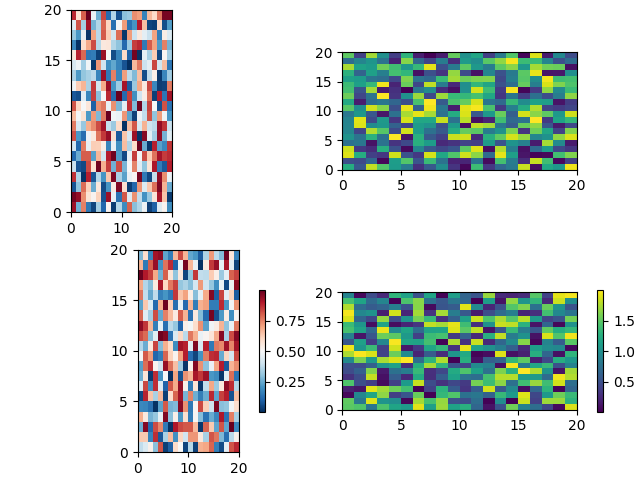
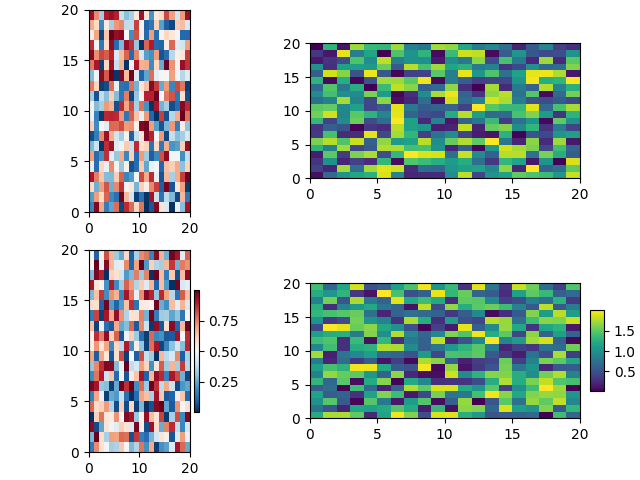
고정 종횡비 축이 있는 컬러바 #
고정 종횡비가 있는 축에 대한 컬러바를 배치하는 것은 데이터 보기에 따라 부모 축의 크기가 변경되기 때문에 특별한 문제가 있습니다.
fig, axs = plt.subplots(2, 2,  constrained_layout=True)
cmaps = ['RdBu_r', 'viridis']
for col in range(2):
    for row in range(2):
        ax = axs[row, col]
        pcm = ax.pcolormesh(np.random.random((20, 20)) * (col + 1),
                            cmap=cmaps[col])
        if col == 0:
            ax.set_aspect(2)
        else:
            ax.set_aspect(1/2)
        if row == 1:
            fig.colorbar(pcm, ax=ax, shrink=0.6)
이 문제를 해결하는 한 가지 방법은 an Axes.inset_axes을 사용하여 축 좌표에서 축을 찾는 것입니다. 축을 확대하고 축의 모양을 변경하면 컬러바의 위치도 변경됩니다.
fig, axs = plt.subplots(2, 2, constrained_layout=True)
cmaps = ['RdBu_r', 'viridis']
for col in range(2):
    for row in range(2):
        ax = axs[row, col]
        pcm = ax.pcolormesh(np.random.random((20, 20)) * (col + 1),
                            cmap=cmaps[col])
        if col == 0:
            ax.set_aspect(2)
        else:
            ax.set_aspect(1/2)
        if row == 1:
            cax = ax.inset_axes([1.04, 0.2, 0.05, 0.6])
            fig.colorbar(pcm, ax=ax, cax=cax)

plt.show()
스크립트의 총 실행 시간: (0분 4.244초)