메모
전체 예제 코드를 다운로드 하려면 여기 를 클릭 하십시오.
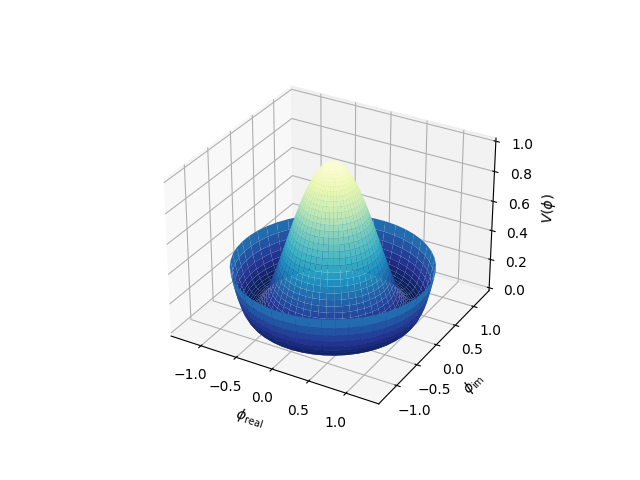
극좌표가 있는 3D 표면 #
극좌표로 정의된 표면을 플로팅하는 방법을 보여줍니다. YlGnBu 컬러맵의 반전 버전을 사용합니다. 또한 라텍스 수학 모드로 축 레이블 작성을 보여줍니다.
Armin Moser가 기여한 예.
import matplotlib.pyplot as plt
import numpy as np


fig = plt.figure()
ax = fig.add_subplot(projection='3d')

# Create the mesh in polar coordinates and compute corresponding Z.
r = np.linspace(0, 1.25, 50)
p = np.linspace(0, 2*np.pi, 50)
R, P = np.meshgrid(r, p)
Z = ((R**2 - 1)**2)

# Express the mesh in the cartesian system.
X, Y = R*np.cos(P), R*np.sin(P)

# Plot the surface.
ax.plot_surface(X, Y, Z, cmap=plt.cm.YlGnBu_r)

# Tweak the limits and add latex math labels.
ax.set_zlim(0, 1)
ax.set_xlabel(r'$\phi_\mathrm{real}$')
ax.set_ylabel(r'$\phi_\mathrm{im}$')
ax.set_zlabel(r'$V(\phi)$')

plt.show()