메모
전체 예제 코드를 다운로드 하려면 여기 를 클릭 하십시오.
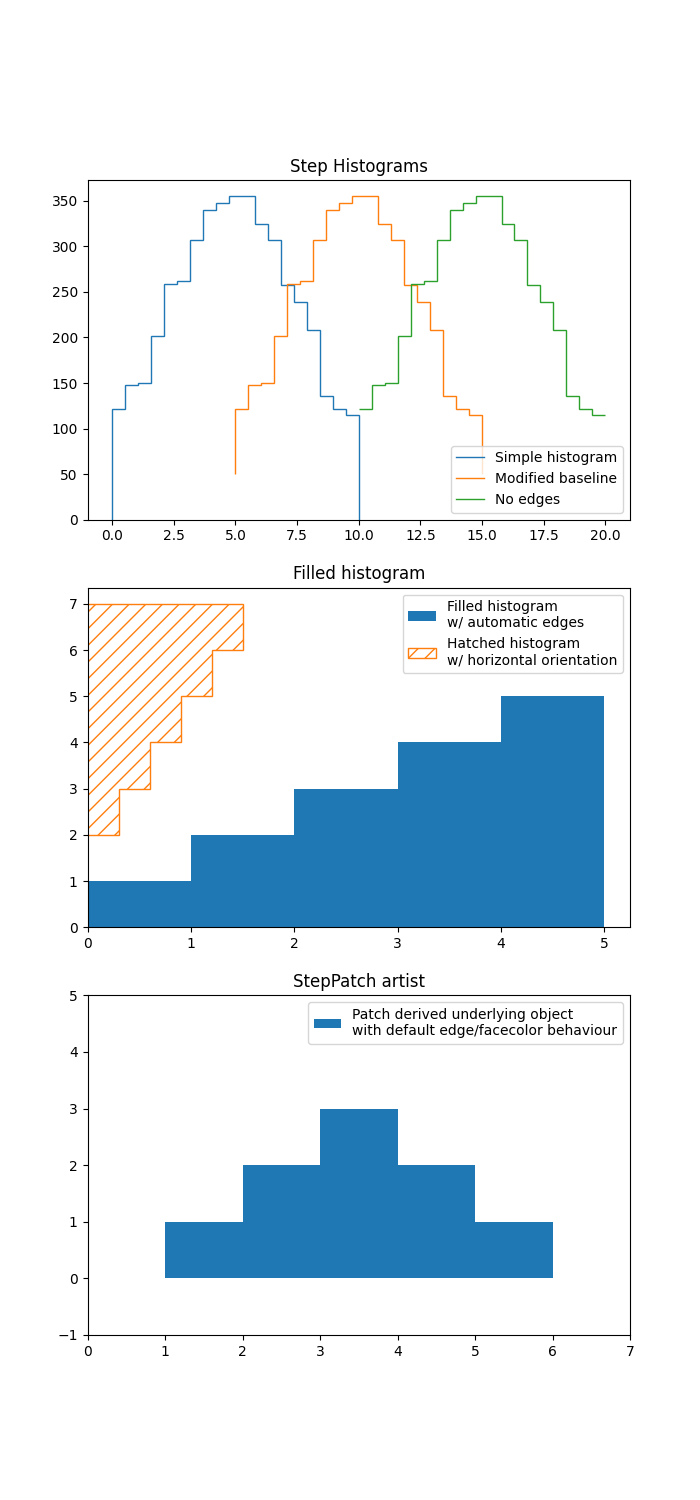
계단 데모 #
이 예제는 stairsfor 단계별 상수 함수의 사용을 보여줍니다. 일반적인 사용 사례는 히스토그램 및 히스토그램과 유사한 데이터 시각화입니다.
import numpy as np
import matplotlib.pyplot as plt
from matplotlib.patches import StepPatch

np.random.seed(0)
h, edges = np.histogram(np.random.normal(5, 3, 5000),
                        bins=np.linspace(0, 10, 20))

fig, axs = plt.subplots(3, 1, figsize=(7, 15))
axs[0].stairs(h, edges, label='Simple histogram')
axs[0].stairs(h, edges + 5, baseline=50, label='Modified baseline')
axs[0].stairs(h, edges + 10, baseline=None, label='No edges')
axs[0].set_title("Step Histograms")

axs[1].stairs(np.arange(1, 6, 1), fill=True,
              label='Filled histogram\nw/ automatic edges')
axs[1].stairs(np.arange(1, 6, 1)*0.3, np.arange(2, 8, 1),
              orientation='horizontal', hatch='//',
              label='Hatched histogram\nw/ horizontal orientation')
axs[1].set_title("Filled histogram")

patch = StepPatch(values=[1, 2, 3, 2, 1],
                  edges=range(1, 7),
                  label=('Patch derived underlying object\n'
                         'with default edge/facecolor behaviour'))
axs[2].add_patch(patch)
axs[2].set_xlim(0, 7)
axs[2].set_ylim(-1, 5)
axs[2].set_title("StepPatch artist")

for ax in axs:
    ax.legend()
plt.show()
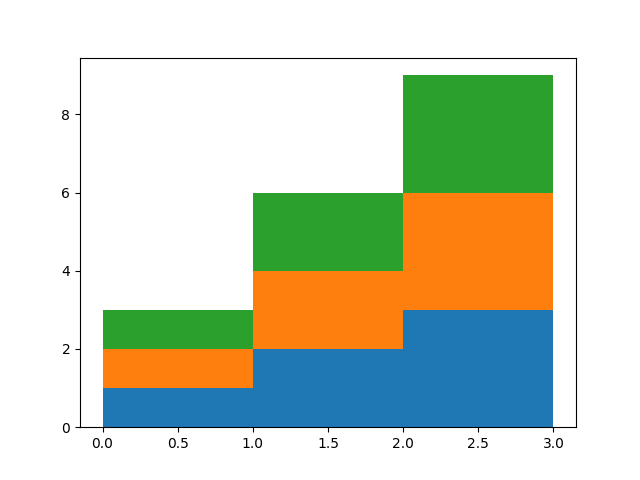
기준선 은 누적 히스토그램 플롯을 허용하기 위해 배열을 사용할 수 있습니다.
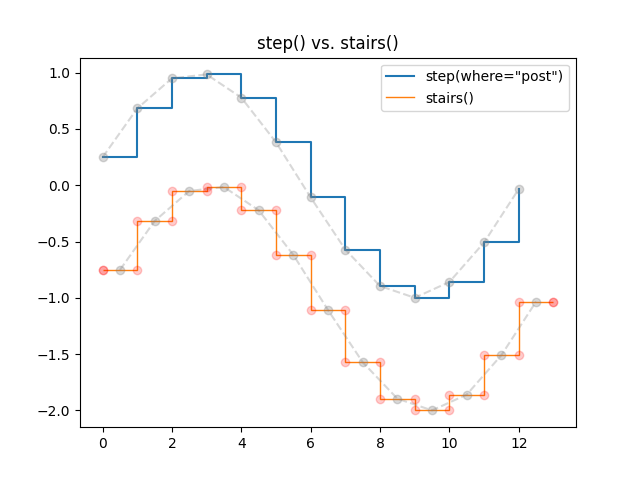
pyplot.step와 # 의 비교pyplot.stairs
pyplot.step단계의 위치를 단일 값으로 정의합니다. 단계는 매개변수 에 따라 이러한 참조 값에서 왼쪽/오른쪽/양방향으로 확장됩니다 . x 와 y 값 의 개수 는 동일합니다.
대조적으로, 단계 값보다 하나 더 긴 요소인 경계 가장자리pyplot.stairs 를 통해 단계의 위치를 정의합니다 .
bins = np.arange(14)
centers = bins[:-1] + np.diff(bins) / 2
y = np.sin(centers / 2)

plt.step(bins[:-1], y, where='post', label='step(where="post")')
plt.plot(bins[:-1], y, 'o--', color='grey', alpha=0.3)

plt.stairs(y - 1, bins, baseline=None, label='stairs()')
plt.plot(centers, y - 1, 'o--', color='grey', alpha=0.3)
plt.plot(np.repeat(bins, 2), np.hstack([y[0], np.repeat(y, 2), y[-1]]) - 1,
         'o', color='red', alpha=0.2)

plt.legend()
plt.title('step() vs. stairs()')
plt.show()
참조
다음 함수, 메서드, 클래스 및 모듈의 사용이 이 예제에 표시됩니다.
스크립트의 총 실행 시간: (0분 1.666초)