메모
전체 예제 코드를 다운로드 하려면 여기 를 클릭 하십시오.
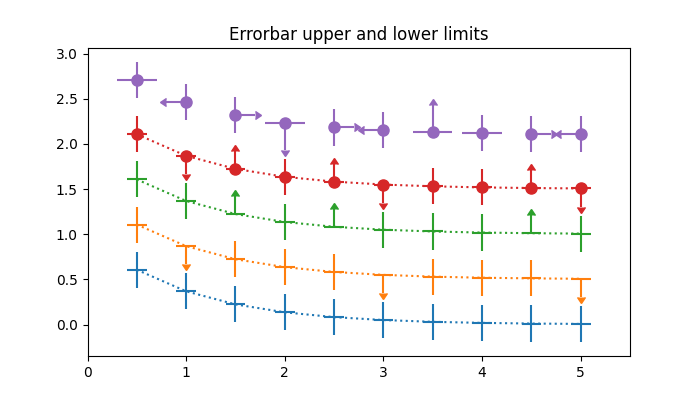
오차 막대에 상한 및 하한 포함 #
matplotlib에서 오류 막대에는 "제한"이 있을 수 있습니다. 오류 막대에 제한을 적용하면 본질적으로 오류가 단방향이 됩니다. 그 때문에 상한과 하한은 각각 , , 및 매개변수를 통해 y 방향과 x 방향 모두에 uplims적용될 lolims수 xuplims있습니다 xlolims. 이러한 매개변수는 스칼라 또는 부울 배열일 수 있습니다.
예를 들어 인 경우 x-오차 막대 xlolims는 True데이터에서 증가하는 값 쪽으로만 확장됩니다. uplims가 4번째 및 7번째 값을 제외하고 채워진 배열 인 경우 False모든 y-오차 막대는 데이터에서 감소하는 y-값으로 확장되는 4번째 및 7번째 막대를 제외하고 양방향이 됩니다.
import numpy as np
import matplotlib.pyplot as plt

# example data
x = np.array([0.5, 1.0, 1.5, 2.0, 2.5, 3.0, 3.5, 4.0, 4.5, 5.0])
y = np.exp(-x)
xerr = 0.1
yerr = 0.2

# lower & upper limits of the error
lolims = np.array([0, 0, 1, 0, 1, 0, 0, 0, 1, 0], dtype=bool)
uplims = np.array([0, 1, 0, 0, 0, 1, 0, 0, 0, 1], dtype=bool)
ls = 'dotted'

fig, ax = plt.subplots(figsize=(7, 4))

# standard error bars
ax.errorbar(x, y, xerr=xerr, yerr=yerr, linestyle=ls)

# including upper limits
ax.errorbar(x, y + 0.5, xerr=xerr, yerr=yerr, uplims=uplims,
            linestyle=ls)

# including lower limits
ax.errorbar(x, y + 1.0, xerr=xerr, yerr=yerr, lolims=lolims,
            linestyle=ls)

# including upper and lower limits
ax.errorbar(x, y + 1.5, xerr=xerr, yerr=yerr,
            lolims=lolims, uplims=uplims,
            marker='o', markersize=8,
            linestyle=ls)

# Plot a series with lower and upper limits in both x & y
# constant x-error with varying y-error
xerr = 0.2
yerr = np.full_like(x, 0.2)
yerr[[3, 6]] = 0.3

# mock up some limits by modifying previous data
xlolims = lolims
xuplims = uplims
lolims = np.zeros_like(x)
uplims = np.zeros_like(x)
lolims[[6]] = True  # only limited at this index
uplims[[3]] = True  # only limited at this index

# do the plotting
ax.errorbar(x, y + 2.1, xerr=xerr, yerr=yerr,
            xlolims=xlolims, xuplims=xuplims,
            uplims=uplims, lolims=lolims,
            marker='o', markersize=8,
            linestyle='none')

# tidy up the figure
ax.set_xlim((0, 5.5))
ax.set_title('Errorbar upper and lower limits')
plt.show()