메모
전체 예제 코드를 다운로드 하려면 여기 를 클릭 하십시오.
불규칙한 간격의 데이터 등고선 플롯 #
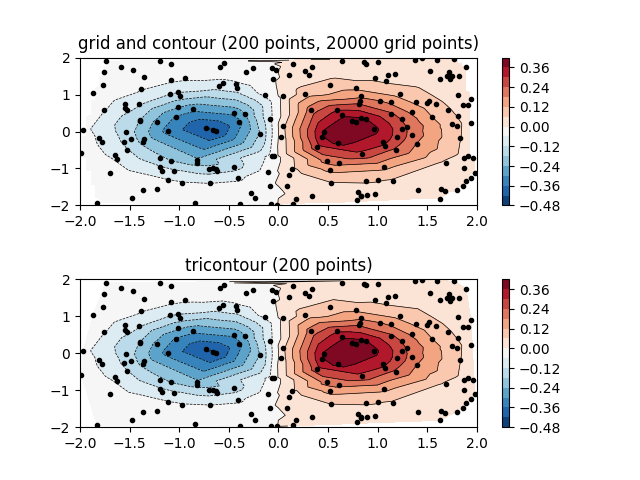
구조화되지 않은 삼각형 격자에 대한 tricontour 플롯과 일반 그리드에 보간된 불규칙한 간격의 데이터의 등고선 플롯 비교.
contour데이터가 규칙적인 그리드에 있을 것으로 contourf기대하기 때문에 불규칙한 간격의 데이터의 등고선 플롯을 플로팅하려면 다른 방법이 필요합니다. 두 가지 옵션은 다음과 같습니다.
먼저 데이터를 일반 그리드에 보간합니다. 이는 온보드 수단(예: via
LinearTriInterpolator또는 외부 기능 사용 )으로 수행할 수 있습니다scipy.interpolate.griddata. 그런 다음 보간된 데이터를 일반적인contour.직접 사용
tricontour하거나tricontourf내부적으로 삼각 측량을 수행합니다.
이 예는 두 가지 방법이 모두 작동하는 것을 보여줍니다.
import matplotlib.pyplot as plt
import matplotlib.tri as tri
import numpy as np

np.random.seed(19680801)
npts = 200
ngridx = 100
ngridy = 200
x = np.random.uniform(-2, 2, npts)
y = np.random.uniform(-2, 2, npts)
z = x * np.exp(-x**2 - y**2)

fig, (ax1, ax2) = plt.subplots(nrows=2)

# -----------------------
# Interpolation on a grid
# -----------------------
# A contour plot of irregularly spaced data coordinates
# via interpolation on a grid.

# Create grid values first.
xi = np.linspace(-2.1, 2.1, ngridx)
yi = np.linspace(-2.1, 2.1, ngridy)

# Linearly interpolate the data (x, y) on a grid defined by (xi, yi).
triang = tri.Triangulation(x, y)
interpolator = tri.LinearTriInterpolator(triang, z)
Xi, Yi = np.meshgrid(xi, yi)
zi = interpolator(Xi, Yi)

# Note that scipy.interpolate provides means to interpolate data on a grid
# as well. The following would be an alternative to the four lines above:
# from scipy.interpolate import griddata
# zi = griddata((x, y), z, (xi[None, :], yi[:, None]), method='linear')

ax1.contour(xi, yi, zi, levels=14, linewidths=0.5, colors='k')
cntr1 = ax1.contourf(xi, yi, zi, levels=14, cmap="RdBu_r")

fig.colorbar(cntr1, ax=ax1)
ax1.plot(x, y, 'ko', ms=3)
ax1.set(xlim=(-2, 2), ylim=(-2, 2))
ax1.set_title('grid and contour (%d points, %d grid points)' %
              (npts, ngridx * ngridy))

# ----------
# Tricontour
# ----------
# Directly supply the unordered, irregularly spaced coordinates
# to tricontour.

ax2.tricontour(x, y, z, levels=14, linewidths=0.5, colors='k')
cntr2 = ax2.tricontourf(x, y, z, levels=14, cmap="RdBu_r")

fig.colorbar(cntr2, ax=ax2)
ax2.plot(x, y, 'ko', ms=3)
ax2.set(xlim=(-2, 2), ylim=(-2, 2))
ax2.set_title('tricontour (%d points)' % npts)

plt.subplots_adjust(hspace=0.5)
plt.show()

참조
다음 함수, 메서드, 클래스 및 모듈의 사용이 이 예제에 표시됩니다.