메모
전체 예제 코드를 다운로드 하려면 여기 를 클릭 하십시오.
버튼 #
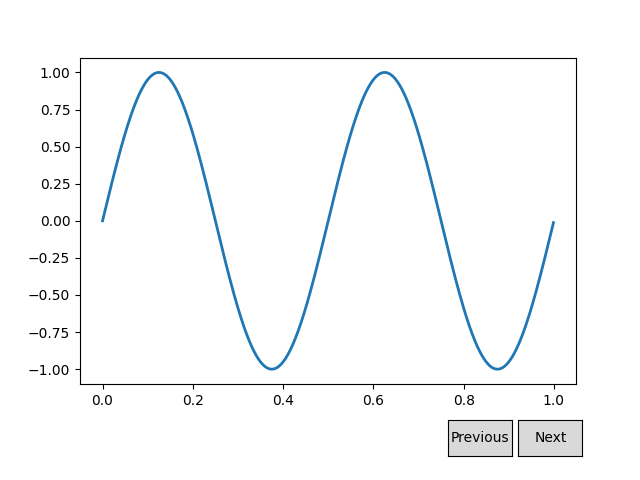
사인파를 수정하는 간단한 버튼 GUI 구성.
next및 previous버튼 위젯은 새로운 주파수로 웨이브를 시각화하는 데 도움이 됩니다 .
import numpy as np
import matplotlib.pyplot as plt
from matplotlib.widgets import Button

freqs = np.arange(2, 20, 3)

fig, ax = plt.subplots()
fig.subplots_adjust(bottom=0.2)
t = np.arange(0.0, 1.0, 0.001)
s = np.sin(2*np.pi*freqs[0]*t)
l, = ax.plot(t, s, lw=2)


class Index:
    ind = 0

    def next(self, event):
        self.ind += 1
        i = self.ind % len(freqs)
        ydata = np.sin(2*np.pi*freqs[i]*t)
        l.set_ydata(ydata)
        plt.draw()

    def prev(self, event):
        self.ind -= 1
        i = self.ind % len(freqs)
        ydata = np.sin(2*np.pi*freqs[i]*t)
        l.set_ydata(ydata)
        plt.draw()

callback = Index()
axprev = fig.add_axes([0.7, 0.05, 0.1, 0.075])
axnext = fig.add_axes([0.81, 0.05, 0.1, 0.075])
bnext = Button(axnext, 'Next')
bnext.on_clicked(callback.next)
bprev = Button(axprev, 'Previous')
bprev.on_clicked(callback.prev)

plt.show()

스크립트의 총 실행 시간: ( 0분 1.165초)