메모
전체 예제 코드를 다운로드 하려면 여기 를 클릭 하십시오.
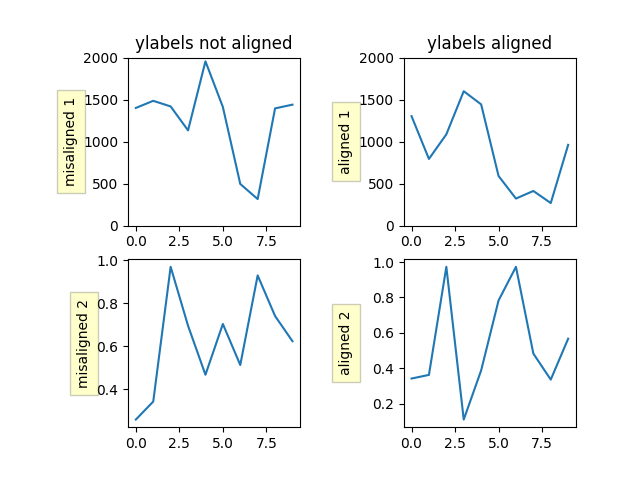
y-레이블 정렬 #
여기에 두 가지 방법이 나와 있습니다. 하나는 짧은 호출을 사용 Figure.align_ylabels
하고 두 번째는 수동으로 레이블을 정렬하는 방법입니다.
import numpy as np
import matplotlib.pyplot as plt


def make_plot(axs):
    box = dict(facecolor='yellow', pad=5, alpha=0.2)

    # Fixing random state for reproducibility
    np.random.seed(19680801)
    ax1 = axs[0, 0]
    ax1.plot(2000*np.random.rand(10))
    ax1.set_title('ylabels not aligned')
    ax1.set_ylabel('misaligned 1', bbox=box)
    ax1.set_ylim(0, 2000)

    ax3 = axs[1, 0]
    ax3.set_ylabel('misaligned 2', bbox=box)
    ax3.plot(np.random.rand(10))

    ax2 = axs[0, 1]
    ax2.set_title('ylabels aligned')
    ax2.plot(2000*np.random.rand(10))
    ax2.set_ylabel('aligned 1', bbox=box)
    ax2.set_ylim(0, 2000)

    ax4 = axs[1, 1]
    ax4.plot(np.random.rand(10))
    ax4.set_ylabel('aligned 2', bbox=box)


# Plot 1:
fig, axs = plt.subplots(2, 2)
fig.subplots_adjust(left=0.2, wspace=0.6)
make_plot(axs)

# just align the last column of axes:
fig.align_ylabels(axs[:, 1])
plt.show()
또한보십시오
Figure.align_ylabels동일한 작업 을 Figure.align_labels수행하는 직접적인 방법입니다. 또한 레이블 정렬
set_label_coords또는 y축 객체의 방법을 사용하여 수동으로 서브플롯 사이의 축 레이블을 수동으로 정렬할 수 있습니다
. 이를 위해서는 하드코딩된 양호한 오프셋 값을 알아야 합니다.

참조
다음 함수, 메서드, 클래스 및 모듈의 사용이 이 예제에 표시됩니다.
스크립트의 총 실행 시간: (0분 1.128초)