메모
전체 예제 코드를 다운로드 하려면 여기 를 클릭 하십시오.
그림 레이블: suptitle, supxlabel, supylabel #
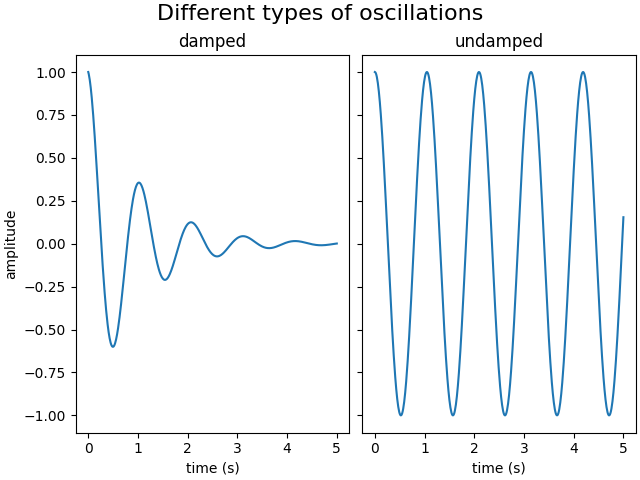
각 축에는 제목이 있을 수 있지만(또는 실제로는 3개 - 각각 " left ", "center" 및 "right" 위치가 있는 하나씩) 를 사용하여 전체 그림(또는 SubFigure)에 전체 제목을 지정하는 것이 바람직할 때가 FigureBase.suptitle있습니다.
FigureBase.supxlabel및
를 사용하여 그림 수준 x 및 y 레이블을 추가할 수도 있습니다 FigureBase.supylabel.
from matplotlib.cbook import get_sample_data
import matplotlib.pyplot as plt

import numpy as np


x = np.linspace(0.0, 5.0, 501)

fig, (ax1, ax2) = plt.subplots(1, 2, constrained_layout=True, sharey=True)
ax1.plot(x, np.cos(6*x) * np.exp(-x))
ax1.set_title('damped')
ax1.set_xlabel('time (s)')
ax1.set_ylabel('amplitude')

ax2.plot(x, np.cos(6*x))
ax2.set_xlabel('time (s)')
ax2.set_title('undamped')

fig.suptitle('Different types of oscillations', fontsize=16)

Text(0.5, 0.99131875, 'Different types of oscillations')
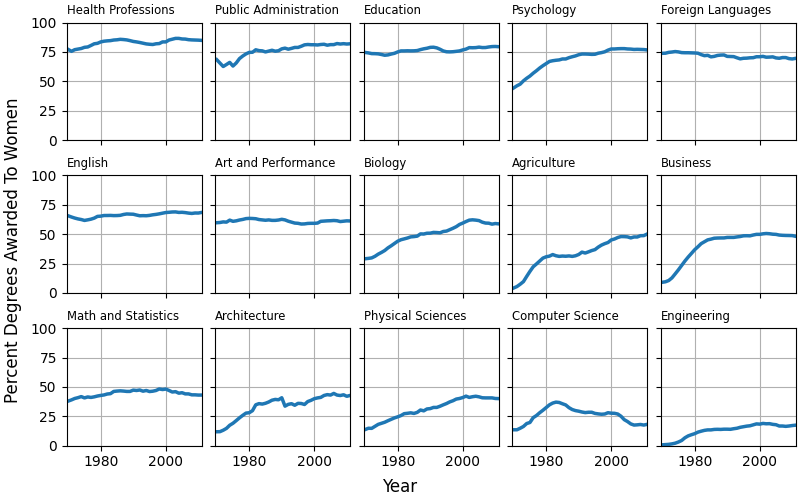
FigureBase.supxlabel글로벌 x- 또는 y-레이블은 및
FigureBase.supylabel메소드 를 사용하여 설정할 수 있습니다 .
fig, axs = plt.subplots(3, 5, figsize=(8, 5), constrained_layout=True,
                        sharex=True, sharey=True)

fname = get_sample_data('percent_bachelors_degrees_women_usa.csv',
                        asfileobj=False)
gender_degree_data = np.genfromtxt(fname, delimiter=',', names=True)

majors = ['Health Professions', 'Public Administration', 'Education',
          'Psychology', 'Foreign Languages', 'English',
          'Art and Performance', 'Biology',
          'Agriculture', 'Business',
          'Math and Statistics', 'Architecture', 'Physical Sciences',
          'Computer Science', 'Engineering']

for nn, ax in enumerate(axs.flat):
    ax.set_xlim(1969.5, 2011.1)
    column = majors[nn]
    column_rec_name = column.replace('\n', '_').replace(' ', '_')

    line, = ax.plot('Year', column_rec_name, data=gender_degree_data,
                    lw=2.5)
    ax.set_title(column, fontsize='small', loc='left')
    ax.set_ylim([0, 100])
    ax.grid()
fig.supxlabel('Year')
fig.supylabel('Percent Degrees Awarded To Women')

plt.show()

스크립트의 총 실행 시간: ( 0분 2.878초)