메모
전체 예제 코드를 다운로드 하려면 여기 를 클릭 하십시오.
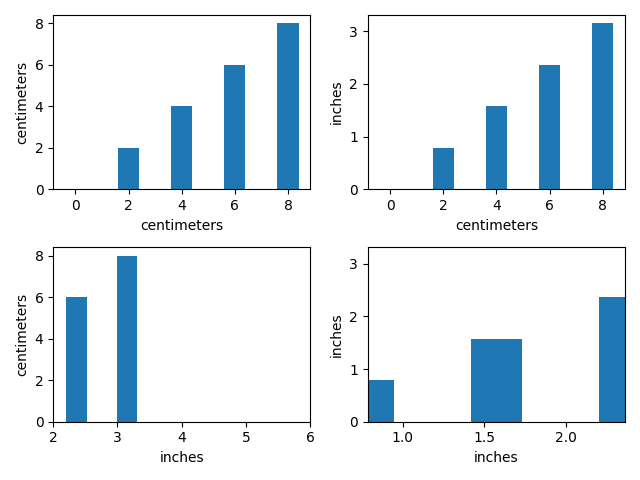
단위가 있는 바 데모 #
다양한 센티미터 및 인치 변환을 사용하는 도표. 이 예는 기본 단위 검사가 작동하는 방식(ax1), x 및 y 단위를 설정하여 기본값(ax2, ax3, ax4)을 재정의하기 위해 다양한 키워드를 사용하는 방법 및 스칼라를 사용하여 xlimit를 설정하는 방법(ax3, 현재 단위)을 보여줍니다. 가정) 또는 단위(숫자를 현재 단위로 가져오기 위해 적용되는 변환)입니다.
이 예에는 다음이 필요합니다.basic_units.py
import numpy as np
from basic_units import cm, inch
import matplotlib.pyplot as plt

cms = cm * np.arange(0, 10, 2)
bottom = 0 * cm
width = 0.8 * cm

fig, axs = plt.subplots(2, 2)

axs[0, 0].bar(cms, cms, bottom=bottom)

axs[0, 1].bar(cms, cms, bottom=bottom, width=width, xunits=cm, yunits=inch)

axs[1, 0].bar(cms, cms, bottom=bottom, width=width, xunits=inch, yunits=cm)
axs[1, 0].set_xlim(2, 6)  # scalars are interpreted in current units

axs[1, 1].bar(cms, cms, bottom=bottom, width=width, xunits=inch, yunits=inch)
axs[1, 1].set_xlim(2 * cm, 6 * cm)  # cm are converted to inches

fig.tight_layout()
plt.show()