메모
전체 예제 코드를 다운로드 하려면 여기 를 클릭 하십시오.
이벤트플롯 데모 #
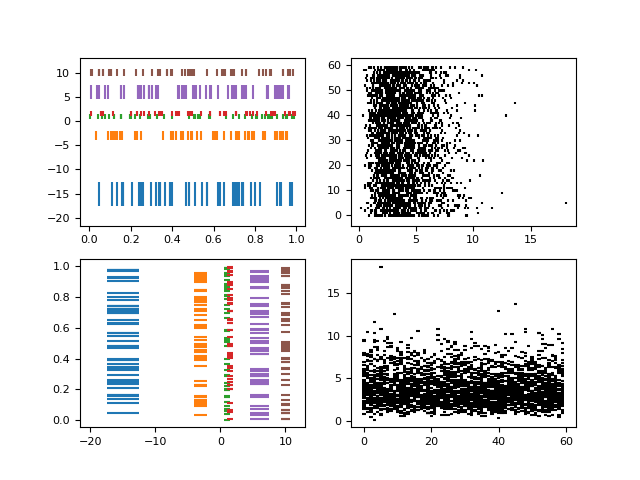
다양한 라인 속성을 가진 일련의 이벤트를 보여주는 이벤트 플롯. 플롯은 가로 및 세로 방향 모두로 표시됩니다.

import matplotlib.pyplot as plt
import numpy as np
import matplotlib
matplotlib.rcParams['font.size'] = 8.0

# Fixing random state for reproducibility
np.random.seed(19680801)


# create random data
data1 = np.random.random([6, 50])

# set different colors for each set of positions
colors1 = ['C{}'.format(i) for i in range(6)]

# set different line properties for each set of positions
# note that some overlap
lineoffsets1 = [-15, -3, 1, 1.5, 6, 10]
linelengths1 = [5, 2, 1, 1, 3, 1.5]

fig, axs = plt.subplots(2, 2)

# create a horizontal plot
axs[0, 0].eventplot(data1, colors=colors1, lineoffsets=lineoffsets1,
                    linelengths=linelengths1)

# create a vertical plot
axs[1, 0].eventplot(data1, colors=colors1, lineoffsets=lineoffsets1,
                    linelengths=linelengths1, orientation='vertical')

# create another set of random data.
# the gamma distribution is only used for aesthetic purposes
data2 = np.random.gamma(4, size=[60, 50])

# use individual values for the parameters this time
# these values will be used for all data sets (except lineoffsets2, which
# sets the increment between each data set in this usage)
colors2 = 'black'
lineoffsets2 = 1
linelengths2 = 1

# create a horizontal plot
axs[0, 1].eventplot(data2, colors=colors2, lineoffsets=lineoffsets2,
                    linelengths=linelengths2)


# create a vertical plot
axs[1, 1].eventplot(data2, colors=colors2, lineoffsets=lineoffsets2,
                    linelengths=linelengths2, orientation='vertical')

plt.show()