메모
전체 예제 코드를 다운로드 하려면 여기 를 클릭 하십시오.
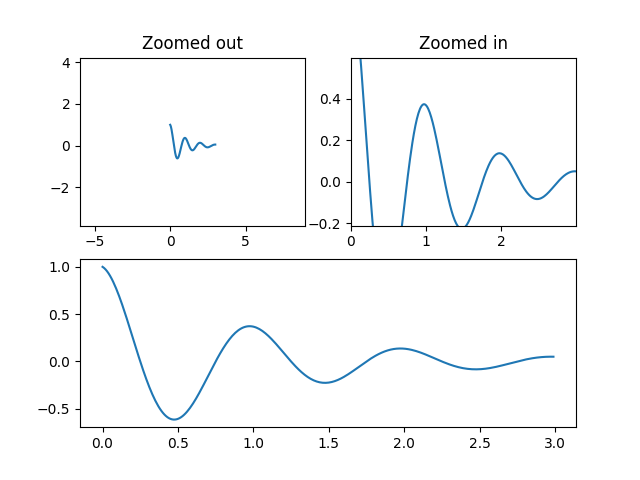
여백과 sticky_edges를 사용하여 보기 제한 제어하기 #
이 예제의 첫 번째 그림은 및
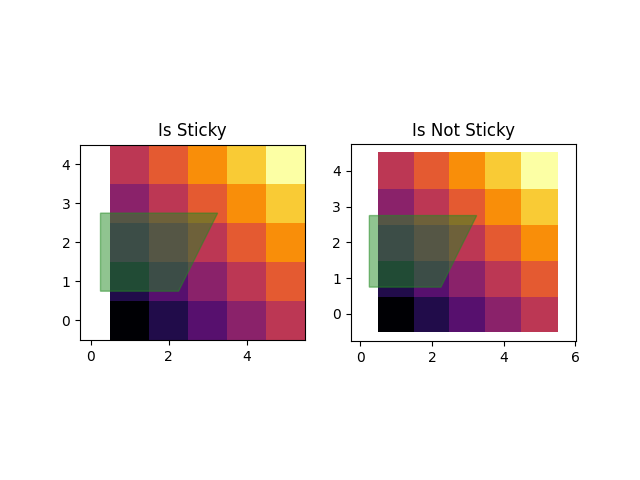
margins대신 사용하여 플롯을 확대 및 축소하는 방법을 보여줍니다 . 두 번째 그림은 특정 방법 및 아티스트가 도입한 가장자리 "끈적임"의 개념과 이를 효과적으로 해결하는 방법을 보여줍니다.set_xlimset_ylim
import numpy as np
import matplotlib.pyplot as plt
from matplotlib.patches import Polygon


def f(t):
    return np.exp(-t) * np.cos(2*np.pi*t)


t1 = np.arange(0.0, 3.0, 0.01)

ax1 = plt.subplot(212)
ax1.margins(0.05)           # Default margin is 0.05, value 0 means fit
ax1.plot(t1, f(t1))

ax2 = plt.subplot(221)
ax2.margins(2, 2)           # Values >0.0 zoom out
ax2.plot(t1, f(t1))
ax2.set_title('Zoomed out')

ax3 = plt.subplot(222)
ax3.margins(x=0, y=-0.25)   # Values in (-0.5, 0.0) zooms in to center
ax3.plot(t1, f(t1))
ax3.set_title('Zoomed in')

plt.show()
특정 플로팅 방법의 "끈적임"에 대해 #
일부 플로팅 기능은 축 제한을 "고정"시키거나 margins방법의 의지에 영향을 받지 않게 합니다. 예를 들어, imshow사용자
pcolor는 플롯에 표시된 픽셀 주위에 제한이 엄격하기를 원할 것입니다. 이 동작을 원하지 않는 경우 로 설정해야
use_sticky_edges합니다 False. 다음 예를 고려하십시오.
y, x = np.mgrid[:5, 1:6]
poly_coords = [
    (0.25, 2.75), (3.25, 2.75),
    (2.25, 0.75), (0.25, 0.75)
]
fig, (ax1, ax2) = plt.subplots(ncols=2)

# Here we set the stickiness of the axes object...
# ax1 we'll leave as the default, which uses sticky edges
# and we'll turn off stickiness for ax2
ax2.use_sticky_edges = False

for ax, status in zip((ax1, ax2), ('Is', 'Is Not')):
    cells = ax.pcolor(x, y, x+y, cmap='inferno', shading='auto')  # sticky
    ax.add_patch(
        Polygon(poly_coords, color='forestgreen', alpha=0.5)
    )  # not sticky
    ax.margins(x=0.1, y=0.05)
    ax.set_aspect('equal')
    ax.set_title('{} Sticky'.format(status))

plt.show()
참조
다음 함수, 메서드, 클래스 및 모듈의 사용이 이 예제에 표시됩니다.