메모
전체 예제 코드를 다운로드 하려면 여기 를 클릭 하십시오.
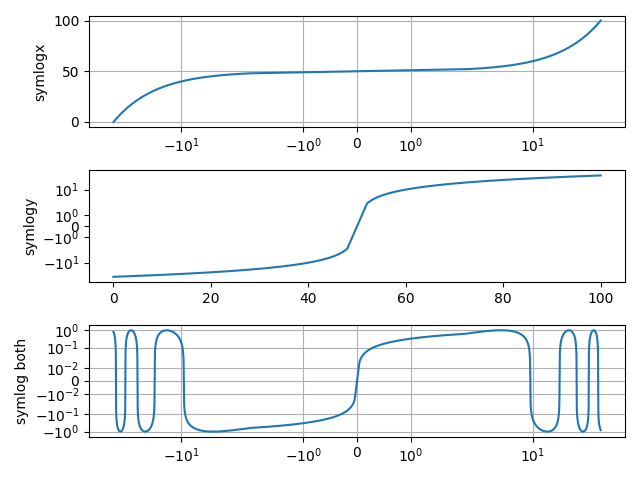
Symlog 데모 #
symlog(대칭 로그) 축 스케일링의 사용 예.
import matplotlib.pyplot as plt
import numpy as np

dt = 0.01
x = np.arange(-50.0, 50.0, dt)
y = np.arange(0, 100.0, dt)

fig, (ax0, ax1, ax2) = plt.subplots(nrows=3)

ax0.plot(x, y)
ax0.set_xscale('symlog')
ax0.set_ylabel('symlogx')
ax0.grid()
ax0.xaxis.grid(which='minor')  # minor grid on too

ax1.plot(y, x)
ax1.set_yscale('symlog')
ax1.set_ylabel('symlogy')

ax2.plot(x, np.sin(x / 3.0))
ax2.set_xscale('symlog')
ax2.set_yscale('symlog', linthresh=0.015)
ax2.grid()
ax2.set_ylabel('symlog both')

fig.tight_layout()
plt.show()
에서 사용하는 좌표 변환 symlog
은 선형 영역과 대수 영역 사이의 전환에서 불연속적인 기울기를 가집니다. 축 눈금은 이러한 asinh불연속성으로 인해 발생하는 시각적 아티팩트를 피할 수 있는 대체 기술입니다.
참조