메모
전체 예제 코드를 다운로드 하려면 여기 를 클릭 하십시오.
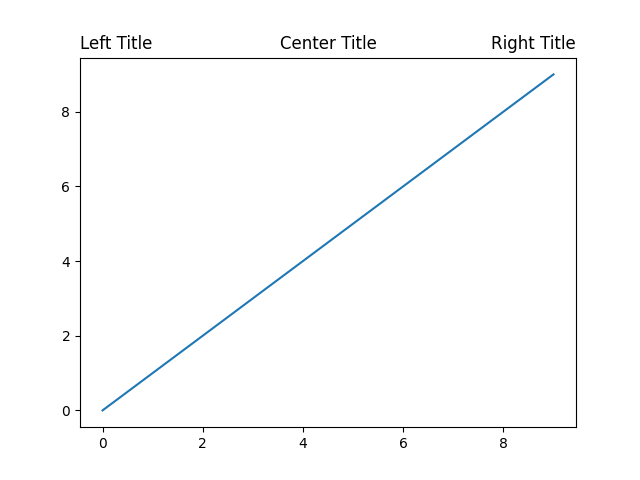
타이틀 포지셔닝 #
Matplotlib는 플롯 제목을 중앙에 표시하고, 축 세트의 왼쪽과 같은 높이로, 축 세트의 오른쪽과 같은 높이로 표시할 수 있습니다.
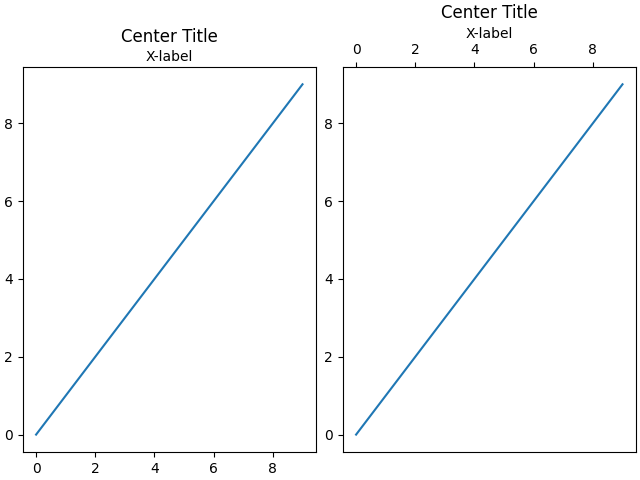
세로 위치는 맨 위 x축에 장식(예: 레이블 및 눈금)을 피하기 위해 자동으로 선택됩니다.
fig, axs = plt.subplots(1, 2, constrained_layout=True)

ax = axs[0]
ax.plot(range(10))
ax.xaxis.set_label_position('top')
ax.set_xlabel('X-label')
ax.set_title('Center Title')

ax = axs[1]
ax.plot(range(10))
ax.xaxis.set_label_position('top')
ax.xaxis.tick_top()
ax.set_xlabel('X-label')
ax.set_title('Center Title')
plt.show()
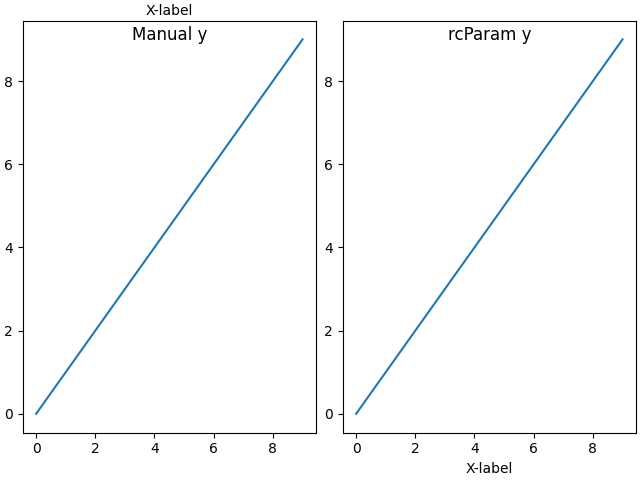
rcParams에서 제목 또는 설정 (기본값: )에 대한 y
키워드 인수를 수동으로 지정하여 자동 위치 지정을 끌 수 있습니다 .rcParams["axes.titley"]None
fig, axs = plt.subplots(1, 2, constrained_layout=True)

ax = axs[0]
ax.plot(range(10))
ax.xaxis.set_label_position('top')
ax.set_xlabel('X-label')
ax.set_title('Manual y', y=1.0, pad=-14)

plt.rcParams['axes.titley'] = 1.0    # y is in axes-relative coordinates.
plt.rcParams['axes.titlepad'] = -14  # pad is in points...
ax = axs[1]
ax.plot(range(10))
ax.set_xlabel('X-label')
ax.set_title('rcParam y')

plt.show()
스크립트의 총 실행 시간: (0분 1.605초)