메모
전체 예제 코드를 다운로드 하려면 여기 를 클릭 하십시오.
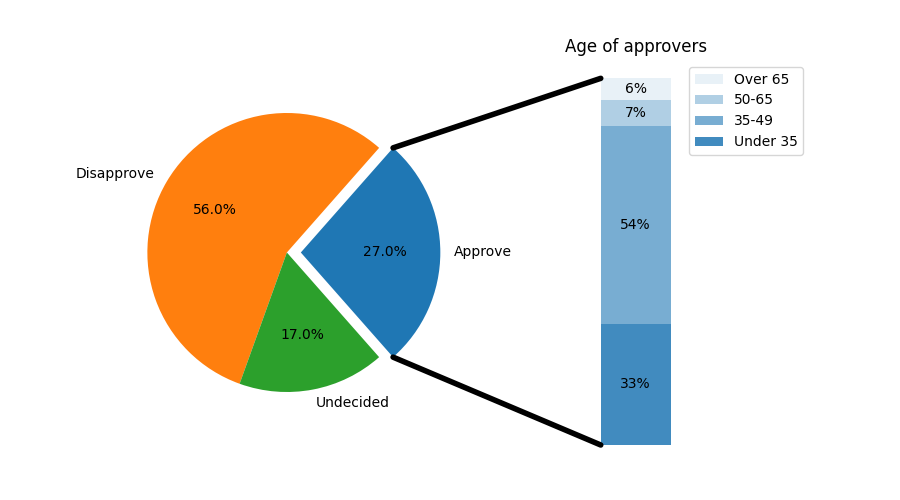
파이의 바 #
파이의 첫 번째 조각이 해당 조각의 특성에 대한 추가 분석과 함께 막대 차트로 "폭발"되는 "파이 막대" 차트를 만듭니다. 이 예는 여러 축 세트가 있는 그림을 사용하고 축 패치 목록을 사용하여 두 개의 ConnectionPatches를 추가하여 서브플롯 차트를 연결하는 방법을 보여줍니다.
import matplotlib.pyplot as plt
from matplotlib.patches import ConnectionPatch
import numpy as np

# make figure and assign axis objects
fig, (ax1, ax2) = plt.subplots(1, 2, figsize=(9, 5))
fig.subplots_adjust(wspace=0)

# pie chart parameters
overall_ratios = [.27, .56, .17]
labels = ['Approve', 'Disapprove', 'Undecided']
explode = [0.1, 0, 0]
# rotate so that first wedge is split by the x-axis
angle = -180 * overall_ratios[0]
wedges, *_ = ax1.pie(overall_ratios, autopct='%1.1f%%', startangle=angle,
                     labels=labels, explode=explode)

# bar chart parameters
age_ratios = [.33, .54, .07, .06]
age_labels = ['Under 35', '35-49', '50-65', 'Over 65']
bottom = 1
width = .2

# Adding from the top matches the legend.
for j, (height, label) in enumerate(reversed([*zip(age_ratios, age_labels)])):
    bottom -= height
    bc = ax2.bar(0, height, width, bottom=bottom, color='C0', label=label,
                 alpha=0.1 + 0.25 * j)
    ax2.bar_label(bc, labels=[f"{height:.0%}"], label_type='center')

ax2.set_title('Age of approvers')
ax2.legend()
ax2.axis('off')
ax2.set_xlim(- 2.5 * width, 2.5 * width)

# use ConnectionPatch to draw lines between the two plots
theta1, theta2 = wedges[0].theta1, wedges[0].theta2
center, r = wedges[0].center, wedges[0].r
bar_height = sum(age_ratios)

# draw top connecting line
x = r * np.cos(np.pi / 180 * theta2) + center[0]
y = r * np.sin(np.pi / 180 * theta2) + center[1]
con = ConnectionPatch(xyA=(-width / 2, bar_height), coordsA=ax2.transData,
                      xyB=(x, y), coordsB=ax1.transData)
con.set_color([0, 0, 0])
con.set_linewidth(4)
ax2.add_artist(con)

# draw bottom connecting line
x = r * np.cos(np.pi / 180 * theta1) + center[0]
y = r * np.sin(np.pi / 180 * theta1) + center[1]
con = ConnectionPatch(xyA=(-width / 2, 0), coordsA=ax2.transData,
                      xyB=(x, y), coordsB=ax1.transData)
con.set_color([0, 0, 0])
ax2.add_artist(con)
con.set_linewidth(4)

plt.show()
참조
다음 함수, 메서드, 클래스 및 모듈의 사용이 이 예제에 표시됩니다.