메모
전체 예제 코드를 다운로드 하려면 여기 를 클릭 하십시오.
쿼드메시 데모 #
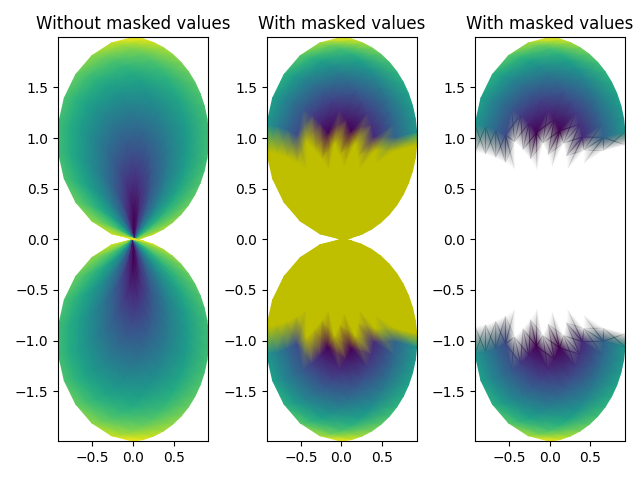
pcolormeshQuadMesh의 빠른 일반화인 를 사용 pcolor하지만 몇 가지 제한 사항이 있습니다.
이 데모는 마스킹된 데이터가 있는 quadmesh의 버그를 보여줍니다.
from matplotlib import pyplot as plt
import numpy as np

n = 12
x = np.linspace(-1.5, 1.5, n)
y = np.linspace(-1.5, 1.5, n * 2)
X, Y = np.meshgrid(x, y)
Qx = np.cos(Y) - np.cos(X)
Qz = np.sin(Y) + np.sin(X)
Z = np.sqrt(X**2 + Y**2) / 5
Z = (Z - Z.min()) / (Z.max() - Z.min())

# The color array can include masked values.
Zm = np.ma.masked_where(np.abs(Qz) < 0.5 * np.max(Qz), Z)

fig, axs = plt.subplots(nrows=1, ncols=3)
axs[0].pcolormesh(Qx, Qz, Z, shading='gouraud')
axs[0].set_title('Without masked values')

# You can control the color of the masked region.
cmap = plt.colormaps[plt.rcParams['image.cmap']].with_extremes(bad='y')
axs[1].pcolormesh(Qx, Qz, Zm, shading='gouraud', cmap=cmap)
axs[1].set_title('With masked values')

# Or use the default, which is transparent.
axs[2].pcolormesh(Qx, Qz, Zm, shading='gouraud')
axs[2].set_title('With masked values')

fig.tight_layout()
plt.show()

참조
다음 함수, 메서드, 클래스 및 모듈의 사용이 이 예제에 표시됩니다.
스크립트의 총 실행 시간: ( 0분 1.257초)