메모
전체 예제 코드를 다운로드 하려면 여기 를 클릭 하십시오.
앤스콤의 사중주 #
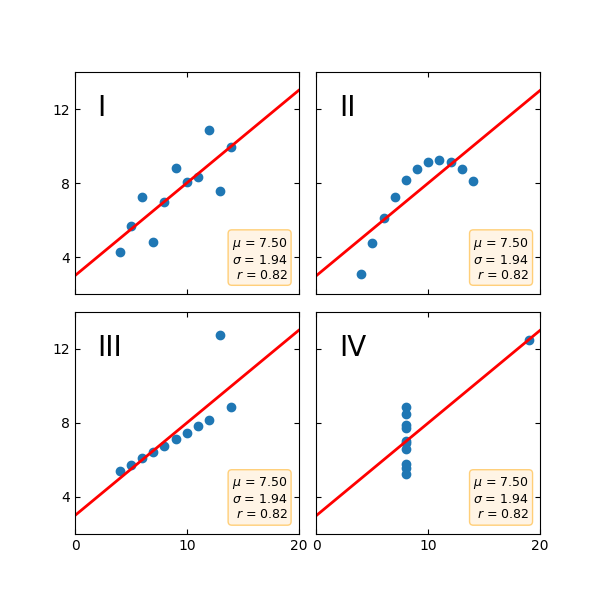
Anscombe의 사중주 는 동일한 평균, 표준 편차 및 회귀선을 갖지만 질적으로 다른 데이터 세트(x, y) 그룹입니다.
기본 통계 속성에만 의존하는 것이 아니라 데이터 집합을 그래픽으로 보는 것의 중요성을 설명하기 위해 종종 사용됩니다.
import matplotlib.pyplot as plt
import numpy as np

x = [10, 8, 13, 9, 11, 14, 6, 4, 12, 7, 5]
y1 = [8.04, 6.95, 7.58, 8.81, 8.33, 9.96, 7.24, 4.26, 10.84, 4.82, 5.68]
y2 = [9.14, 8.14, 8.74, 8.77, 9.26, 8.10, 6.13, 3.10, 9.13, 7.26, 4.74]
y3 = [7.46, 6.77, 12.74, 7.11, 7.81, 8.84, 6.08, 5.39, 8.15, 6.42, 5.73]
x4 = [8, 8, 8, 8, 8, 8, 8, 19, 8, 8, 8]
y4 = [6.58, 5.76, 7.71, 8.84, 8.47, 7.04, 5.25, 12.50, 5.56, 7.91, 6.89]

datasets = {
    'I': (x, y1),
    'II': (x, y2),
    'III': (x, y3),
    'IV': (x4, y4)
}

fig, axs = plt.subplots(2, 2, sharex=True, sharey=True, figsize=(6, 6),
                        gridspec_kw={'wspace': 0.08, 'hspace': 0.08})
axs[0, 0].set(xlim=(0, 20), ylim=(2, 14))
axs[0, 0].set(xticks=(0, 10, 20), yticks=(4, 8, 12))

for ax, (label, (x, y)) in zip(axs.flat, datasets.items()):
    ax.text(0.1, 0.9, label, fontsize=20, transform=ax.transAxes, va='top')
    ax.tick_params(direction='in', top=True, right=True)
    ax.plot(x, y, 'o')

    # linear regression
    p1, p0 = np.polyfit(x, y, deg=1)  # slope, intercept
    ax.axline(xy1=(0, p0), slope=p1, color='r', lw=2)

    # add text box for the statistics
    stats = (f'$\\mu$ = {np.mean(y):.2f}\n'
             f'$\\sigma$ = {np.std(y):.2f}\n'
             f'$r$ = {np.corrcoef(x, y)[0][1]:.2f}')
    bbox = dict(boxstyle='round', fc='blanchedalmond', ec='orange', alpha=0.5)
    ax.text(0.95, 0.07, stats, fontsize=9, bbox=bbox,
            transform=ax.transAxes, horizontalalignment='right')

plt.show()

참조
다음 함수, 메서드, 클래스 및 모듈의 사용이 이 예제에 표시됩니다.
matplotlib.axes.Axes.tick_params/ matplotlib.pyplot.tick_params`