메모
전체 예제 코드를 다운로드 하려면 여기 를 클릭 하십시오.
단순 축 레이블 #
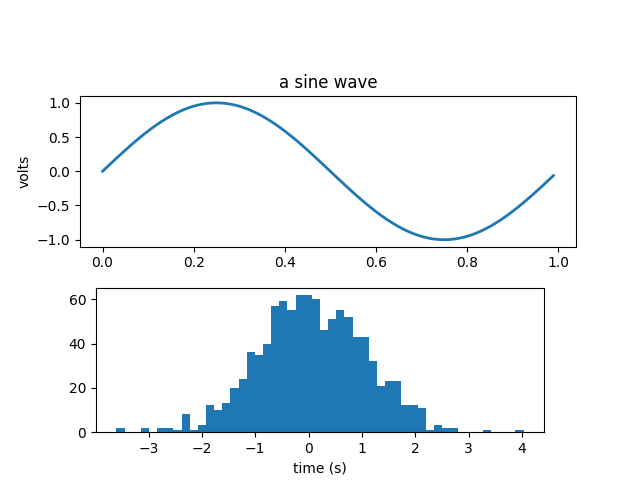
플롯의 축에 레이블을 지정합니다.
import numpy as np
import matplotlib.pyplot as plt

fig = plt.figure()
fig.subplots_adjust(top=0.8)
ax1 = fig.add_subplot(211)
ax1.set_ylabel('volts')
ax1.set_title('a sine wave')

t = np.arange(0.0, 1.0, 0.01)
s = np.sin(2 * np.pi * t)
line, = ax1.plot(t, s, lw=2)

# Fixing random state for reproducibility
np.random.seed(19680801)

ax2 = fig.add_axes([0.15, 0.1, 0.7, 0.3])
n, bins, patches = ax2.hist(np.random.randn(1000), 50)
ax2.set_xlabel('time (s)')

plt.show()

참조
다음 함수, 메서드, 클래스 및 모듈의 사용이 이 예제에 표시됩니다.