메모
전체 예제 코드를 다운로드 하려면 여기 를 클릭 하십시오.
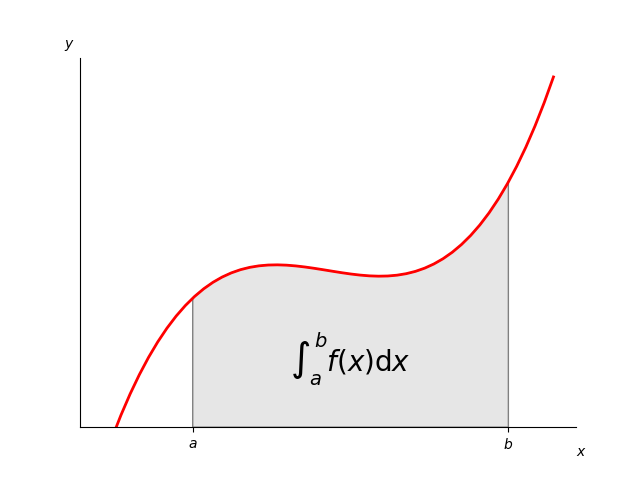
곡선 아래 면적으로 적분 #
이것은 간단한 예이지만 몇 가지 중요한 조정을 보여줍니다.
사용자 정의 색상과 선 너비가 있는 간단한 선 도표.
다각형 패치를 사용하여 만든 음영 영역입니다.
mathtext 렌더링이 포함된 텍스트 레이블입니다.
figtext는 x축과 y축에 레이블을 지정하도록 호출합니다.
축 척추를 사용하여 위쪽 및 오른쪽 척추를 숨깁니다.
사용자 지정 눈금 배치 및 레이블.

import numpy as np
import matplotlib.pyplot as plt
from matplotlib.patches import Polygon


def func(x):
    return (x - 3) * (x - 5) * (x - 7) + 85


a, b = 2, 9  # integral limits
x = np.linspace(0, 10)
y = func(x)

fig, ax = plt.subplots()
ax.plot(x, y, 'r', linewidth=2)
ax.set_ylim(bottom=0)

# Make the shaded region
ix = np.linspace(a, b)
iy = func(ix)
verts = [(a, 0), *zip(ix, iy), (b, 0)]
poly = Polygon(verts, facecolor='0.9', edgecolor='0.5')
ax.add_patch(poly)

ax.text(0.5 * (a + b), 30, r"$\int_a^b f(x)\mathrm{d}x$",
        horizontalalignment='center', fontsize=20)

fig.text(0.9, 0.05, '$x$')
fig.text(0.1, 0.9, '$y$')

ax.spines.right.set_visible(False)
ax.spines.top.set_visible(False)
ax.xaxis.set_ticks_position('bottom')

ax.set_xticks([a, b], labels=['$a$', '$b$'])
ax.set_yticks([])

plt.show()