메모
전체 예제 코드를 다운로드 하려면 여기 를 클릭 하십시오.
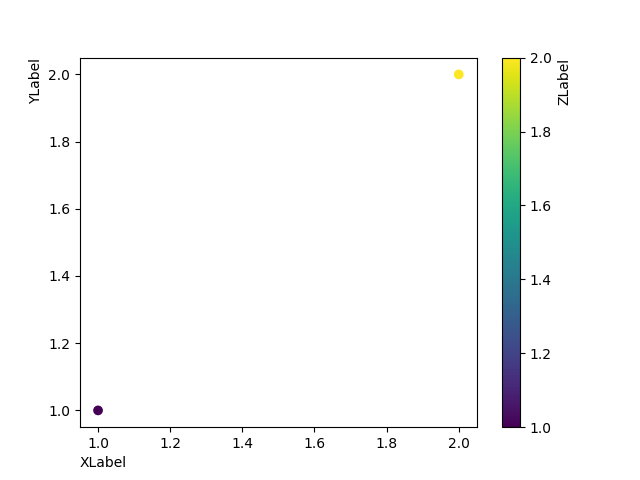
축 레이블 위치 번호
set_xlabel호출할 때 와
컬러바에 대해 축 레이블 위치를 선택합니다 set_ylabel.

import matplotlib.pyplot as plt

fig, ax = plt.subplots()

sc = ax.scatter([1, 2], [1, 2], c=[1, 2])
ax.set_ylabel('YLabel', loc='top')
ax.set_xlabel('XLabel', loc='left')
cbar = fig.colorbar(sc)
cbar.set_label("ZLabel", loc='top')

plt.show()