메모
전체 예제 코드를 다운로드 하려면 여기 를 클릭 하십시오.
여러 데이터 세트가 있는 히스토그램(hist) 함수 #
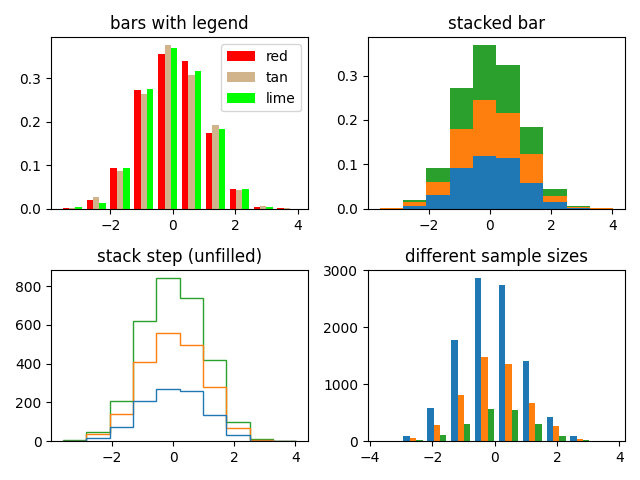
여러 샘플 세트로 히스토그램을 플로팅하고 다음을 시연합니다.
여러 샘플 세트에서 범례 사용
누적 막대
채우기가 없는 단계 곡선
다양한 샘플 크기의 데이터 세트
다른 Bin 도수와 크기를 선택하면 히스토그램의 모양에 상당한 영향을 미칠 수 있습니다. Astropy 문서에는 이러한 매개변수를 선택하는 방법에 대한 훌륭한 섹션이 있습니다. http://docs.astropy.org/en/stable/visualization/histogram.html
import numpy as np
import matplotlib.pyplot as plt

np.random.seed(19680801)

n_bins = 10
x = np.random.randn(1000, 3)

fig, ((ax0, ax1), (ax2, ax3)) = plt.subplots(nrows=2, ncols=2)

colors = ['red', 'tan', 'lime']
ax0.hist(x, n_bins, density=True, histtype='bar', color=colors, label=colors)
ax0.legend(prop={'size': 10})
ax0.set_title('bars with legend')

ax1.hist(x, n_bins, density=True, histtype='bar', stacked=True)
ax1.set_title('stacked bar')

ax2.hist(x, n_bins, histtype='step', stacked=True, fill=False)
ax2.set_title('stack step (unfilled)')

# Make a multiple-histogram of data-sets with different length.
x_multi = [np.random.randn(n) for n in [10000, 5000, 2000]]
ax3.hist(x_multi, n_bins, histtype='bar')
ax3.set_title('different sample sizes')

fig.tight_layout()
plt.show()
