메모
전체 예제 코드를 다운로드 하려면 여기 를 클릭 하십시오.
파이플롯 텍스트 #
import numpy as np
import matplotlib.pyplot as plt
# Fixing random state for reproducibility
np.random.seed(19680801)
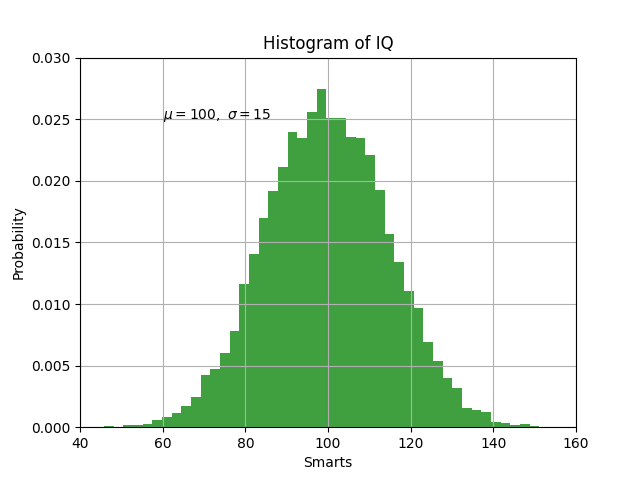
mu, sigma = 100, 15
x = mu + sigma * np.random.randn(10000)
# the histogram of the data
n, bins, patches = plt.hist(x, 50, density=True, facecolor='g', alpha=0.75)
plt.xlabel('Smarts')
plt.ylabel('Probability')
plt.title('Histogram of IQ')
plt.text(60, .025, r'$\mu=100,\ \sigma=15$')
plt.xlim(40, 160)
plt.ylim(0, 0.03)
plt.grid(True)
plt.show()
참조
다음 함수, 메서드, 클래스 및 모듈의 사용이 이 예제에 표시됩니다.