메모
전체 예제 코드를 다운로드 하려면 여기 를 클릭 하십시오.
너무 많은 틱 수정 #
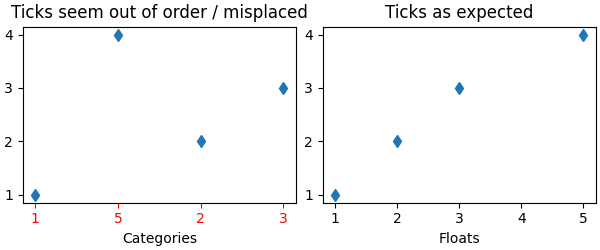
예기치 않은 눈금 동작의 일반적인 원인 중 하나는 숫자나 날짜/시간 개체 대신 문자열 목록을 전달하는 것입니다. 이것은 쉼표로 구분된 텍스트 파일을 읽을 때 예고 없이 쉽게 발생할 수 있습니다. Matplotlib는 문자열 목록을 범주형 변수( 범주형 변수 플로팅 )로 취급하고 기본적으로 범주당 하나의 눈금을 표시하고 제공된 순서대로 플로팅합니다. 이것이 바람직하지 않은 경우 해결 방법은 다음 예제와 같이 문자열을 숫자 유형으로 변환하는 것입니다.
예 1: 문자열은 숫자 틱의 예기치 않은 순서로 이어질 수 있습니다. #
import matplotlib.pyplot as plt
import numpy as np

fig, ax = plt.subplots(1, 2, constrained_layout=True, figsize=(6, 2.5))
x = ['1', '5', '2', '3']
y = [1, 4, 2, 3]
ax[0].plot(x, y, 'd')
ax[0].tick_params(axis='x', color='r', labelcolor='r')
ax[0].set_xlabel('Categories')
ax[0].set_title('Ticks seem out of order / misplaced')

# convert to numbers:
x = np.asarray(x, dtype='float')
ax[1].plot(x, y, 'd')
ax[1].set_xlabel('Floats')
ax[1].set_title('Ticks as expected')

Text(0.5, 1.0, 'Ticks as expected')
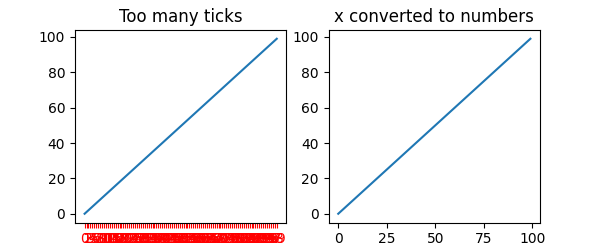
예 2: 문자열은 매우 많은 틱으로 이어질 수 있습니다. #
x 에 모든 문자열인 100개의 요소가 있는 경우 100개의 (읽을 수 없는) 틱이 있을 것이며 다시 해결책은 문자열을 부동 소수점으로 변환하는 것입니다.
fig, ax = plt.subplots(1, 2, figsize=(6, 2.5))
x = [f'{xx}' for xx in np.arange(100)]
y = np.arange(100)
ax[0].plot(x, y)
ax[0].tick_params(axis='x', color='r', labelcolor='r')
ax[0].set_title('Too many ticks')
ax[0].set_xlabel('Categories')

ax[1].plot(np.asarray(x, float), y)
ax[1].set_title('x converted to numbers')
ax[1].set_xlabel('Floats')

Text(0.5, -3.555555555555568, 'Floats')
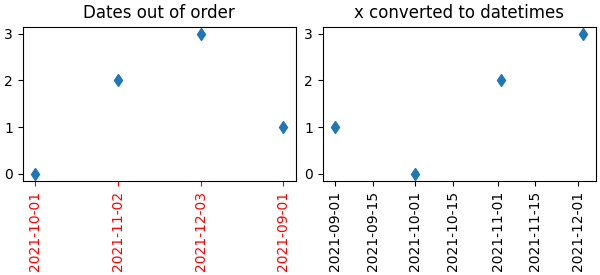
예 3: 문자열은 예기치 않은 날짜/시간 틱 순서로 이어질 수 있습니다. #
일반적인 경우는 CSV 파일에서 날짜를 읽을 때 적절한 날짜 로케이터 및 포맷터를 가져오기 위해 문자열에서 datetime 객체로 변환해야 하는 경우입니다.
fig, ax = plt.subplots(1, 2, constrained_layout=True, figsize=(6, 2.75))
x = ['2021-10-01', '2021-11-02', '2021-12-03', '2021-09-01']
y = [0, 2, 3, 1]
ax[0].plot(x, y, 'd')
ax[0].tick_params(axis='x', labelrotation=90, color='r', labelcolor='r')
ax[0].set_title('Dates out of order')

# convert to datetime64
x = np.asarray(x, dtype='datetime64[s]')
ax[1].plot(x, y, 'd')
ax[1].tick_params(axis='x', labelrotation=90)
ax[1].set_title('x converted to datetimes')

plt.show()

스크립트의 총 실행 시간: (0분 1.403초)