메모
전체 예제 코드를 다운로드 하려면 여기 를 클릭 하십시오.
다중 서브플롯 #
여러 서브플롯이 있는 간단한 데모.
추가 옵션은 plt.subplots 를 사용하여 여러 서브플롯 만들기 를 참조하십시오 .
subplots()간단한 서브플롯 배열을 생성하는 데 권장되는 방법입니다.
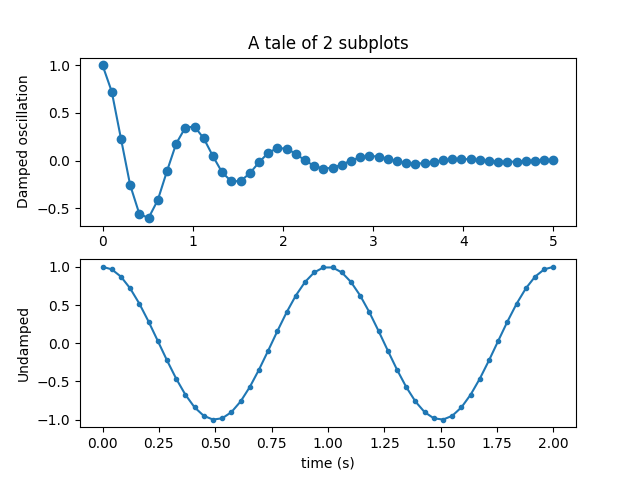
fig, (ax1, ax2) = plt.subplots(2, 1)
fig.suptitle('A tale of 2 subplots')

ax1.plot(x1, y1, 'o-')
ax1.set_ylabel('Damped oscillation')

ax2.plot(x2, y2, '.-')
ax2.set_xlabel('time (s)')
ax2.set_ylabel('Undamped')

plt.show()
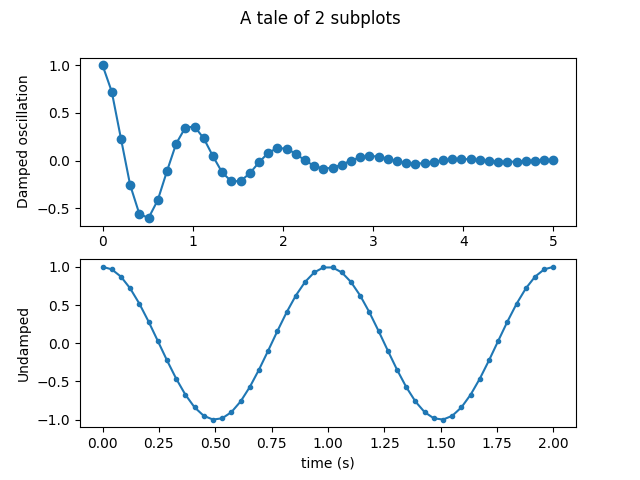
서브플롯은 다음을 사용하여 한 번에 하나씩 생성할 수도 있습니다 subplot().
plt.subplot(2, 1, 1)
plt.plot(x1, y1, 'o-')
plt.title('A tale of 2 subplots')
plt.ylabel('Damped oscillation')

plt.subplot(2, 1, 2)
plt.plot(x2, y2, '.-')
plt.xlabel('time (s)')
plt.ylabel('Undamped')

plt.show()