메모
전체 예제 코드를 다운로드 하려면 여기 를 클릭 하십시오.
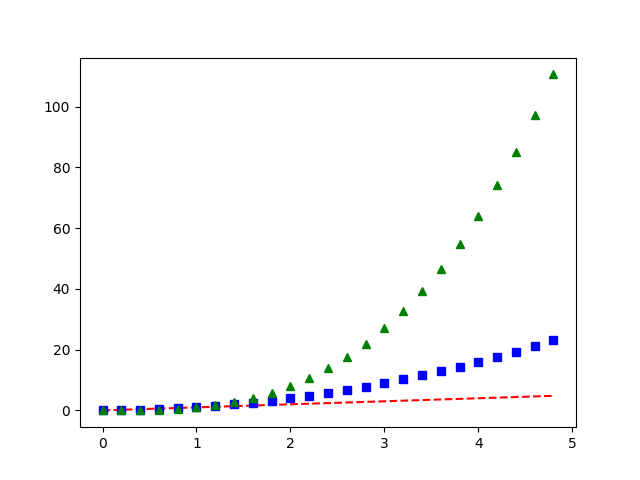
파이플롯 세
에 대한 단일 호출로 세 개의 선 플롯을 플로팅합니다 plot.
import numpy as np
import matplotlib.pyplot as plt

# evenly sampled time at 200ms intervals
t = np.arange(0., 5., 0.2)

# red dashes, blue squares and green triangles
plt.plot(t, t, 'r--', t, t**2, 'bs', t, t**3, 'g^')
plt.show()

참조
다음 함수, 메서드, 클래스 및 모듈의 사용이 이 예제에 표시됩니다.
Sphinx-Gallery에서 생성한 갤러리
