메모
전체 예제 코드를 다운로드 하려면 여기 를 클릭 하십시오.
날짜 틱 로케이터 및 포매터 #
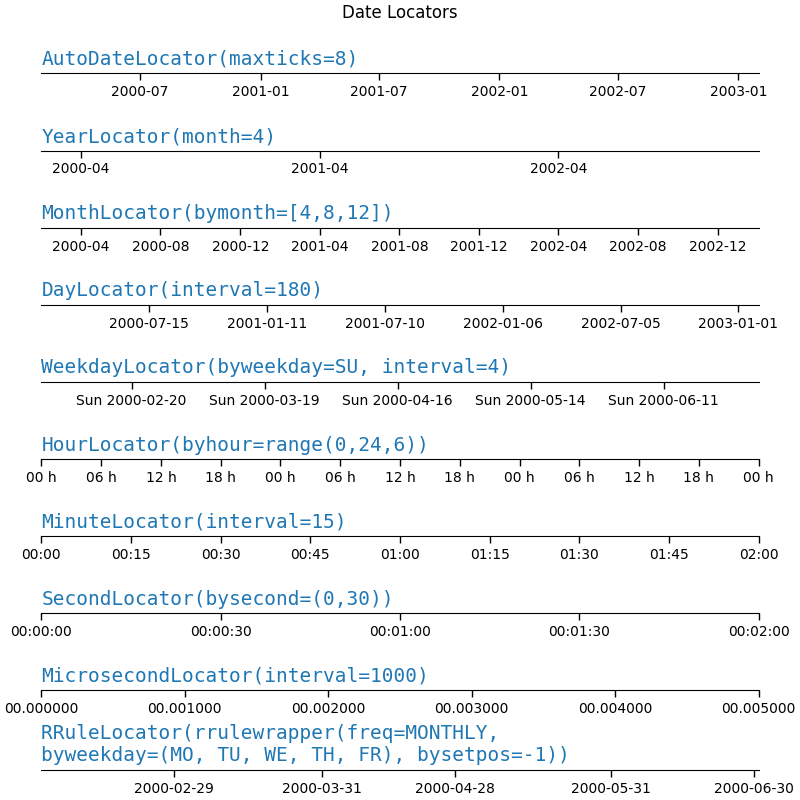
이 예는 다양한 날짜 로케이터 및 포맷터의 사용법과 효과를 보여줍니다.
import numpy as np
import matplotlib.pyplot as plt
import matplotlib.ticker as ticker
from matplotlib.dates import (AutoDateLocator, YearLocator, MonthLocator,
                              DayLocator, WeekdayLocator, HourLocator,
                              MinuteLocator, SecondLocator, MicrosecondLocator,
                              RRuleLocator, rrulewrapper, MONTHLY,
                              MO, TU, WE, TH, FR, SA, SU, DateFormatter,
                              AutoDateFormatter, ConciseDateFormatter)

locators = [
    ('AutoDateLocator(maxticks=8)', '2003-02-01', '%Y-%m'),
    ('YearLocator(month=4)', '2003-02-01', '%Y-%m'),
    ('MonthLocator(bymonth=[4,8,12])', '2003-02-01', '%Y-%m'),
    ('DayLocator(interval=180)', '2003-02-01', '%Y-%m-%d'),
    ('WeekdayLocator(byweekday=SU, interval=4)', '2000-07-01', '%a %Y-%m-%d'),
    ('HourLocator(byhour=range(0,24,6))', '2000-02-04', '%H h'),
    ('MinuteLocator(interval=15)', '2000-02-01 02:00', '%H:%M'),
    ('SecondLocator(bysecond=(0,30))', '2000-02-01 00:02', '%H:%M:%S'),
    ('MicrosecondLocator(interval=1000)', '2000-02-01 00:00:00.005', '%S.%f'),
    ('RRuleLocator(rrulewrapper(freq=MONTHLY, \nbyweekday=(MO, TU, WE, TH,' +
     ' FR), bysetpos=-1))', '2000-07-01', '%Y-%m-%d')
]

formatters = [
    ('AutoDateFormatter(ax.xaxis.get_major_locator())'),
    ('ConciseDateFormatter(ax.xaxis.get_major_locator())'),
    ('DateFormatter("%b %Y")')
]


def plot_axis(ax, locator=None, xmax='2002-02-01', fmt=None, formatter=None):
    """Set up common parameters for the Axes in the example."""
    ax.spines.right.set_visible(False)
    ax.spines.left.set_visible(False)
    ax.spines.top.set_visible(False)
    ax.yaxis.set_major_locator(ticker.NullLocator())
    ax.tick_params(which='major', width=1.00, length=5)
    ax.tick_params(which='minor', width=0.75, length=2.5)
    ax.set_xlim(np.datetime64('2000-02-01'), np.datetime64(xmax))
    if locator:
        ax.xaxis.set_major_locator(eval(locator))
        ax.xaxis.set_major_formatter(DateFormatter(fmt))
    else:
        ax.xaxis.set_major_formatter(eval(formatter))
    ax.text(0.0, 0.2, locator or formatter, transform=ax.transAxes,
            fontsize=14, fontname='Monospace', color='tab:blue')


fig, ax = plt.subplots(len(locators), 1, figsize=(8, len(locators) * .8),
                       layout='constrained')
fig.suptitle('Date Locators')
for i, loc in enumerate(locators):
    plot_axis(ax[i], *loc)

fig, ax = plt.subplots(len(formatters), 1, figsize=(8, len(formatters) * .8),
                       layout='constrained')
fig.suptitle('Date Formatters')
for i, fmt in enumerate(formatters):
    plot_axis(ax[i], formatter=fmt)
참조
다음 함수, 메서드, 클래스 및 모듈의 사용이 이 예제에 표시됩니다.
스크립트의 총 실행 시간: ( 0분 2.097초)

