메모
전체 예제 코드를 다운로드 하려면 여기 를 클릭 하십시오.
3D 스템 #
기준선에서 z 좌표까지의 수직선을 플로팅 하고 끝에 마커를 배치하는 3D 스템 플롯 데모 .
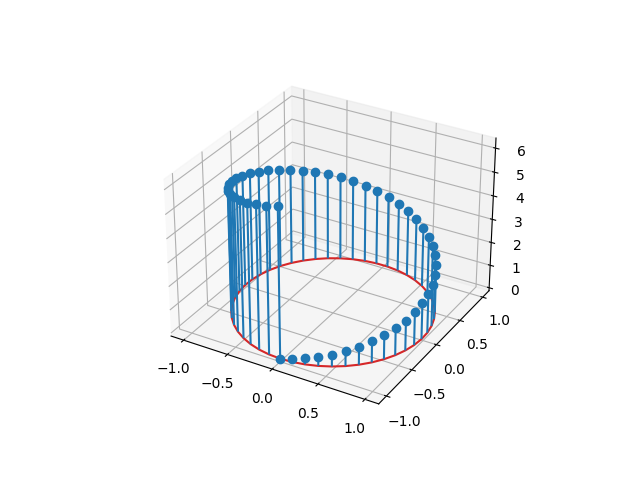
기준선의 위치는 bottom 을 사용하여 조정할 수 있습니다 . 매개변수
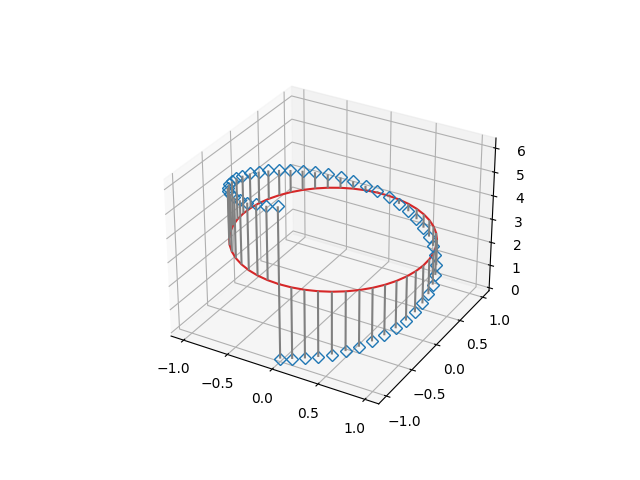
linefmt , markerfmt 및 basefmt 는 플롯의 기본 형식 속성을 제어합니다. 그러나 plot모든 속성이 키워드 인수를 통해 구성 가능한 것은 아닙니다. 고급 제어를 위해 에서 반환한 선 개체를 조정합니다 stem3D.
fig, ax = plt.subplots(subplot_kw=dict(projection='3d'))
markerline, stemlines, baseline = ax.stem(
    x, y, z, linefmt='grey', markerfmt='D', bottom=np.pi)
markerline.set_markerfacecolor('none')

plt.show()
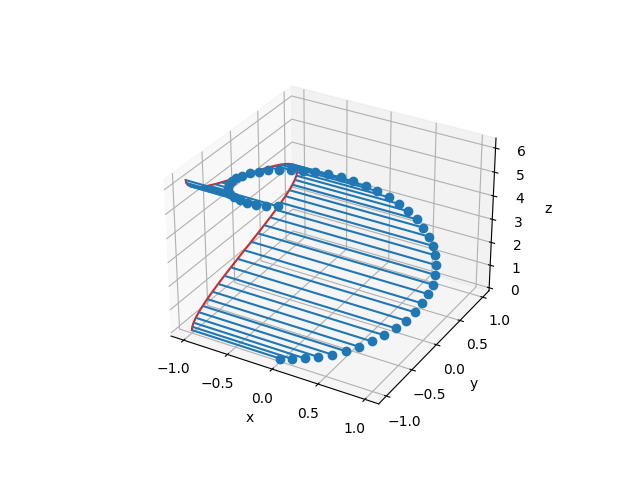
줄기와 기준선의 방향은 orientation 을 사용하여 변경할 수 있습니다 . 이것은 줄기가 헤드 포인트에서 아래쪽 기준선 을 향해 투영되는 방향을 결정합니다 .
예를 들어 를 설정 orientation='x'하면 줄기가 x 방향을 따라 투영되고 기준선은 yz 평면에 있습니다.
스크립트의 총 실행 시간: (0분 1.453초)