메모
전체 예제 코드를 다운로드 하려면 여기 를 클릭 하십시오.
BboxImage 데모 #
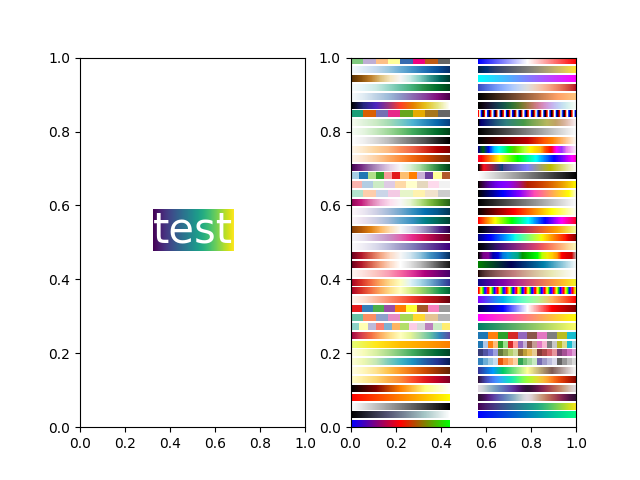
A BboxImage는 경계 상자에 따라 이미지를 배치하는 데 사용할 수 있습니다. 이 데모는 의 경계 상자 안에 이미지를 표시하는 방법과 이미지 text.Text의 경계 상자를 수동으로 만드는 방법을 보여줍니다.
import matplotlib.pyplot as plt
import numpy as np
from matplotlib.image import BboxImage
from matplotlib.transforms import Bbox, TransformedBbox


fig, (ax1, ax2) = plt.subplots(ncols=2)

# ----------------------------
# Create a BboxImage with Text
# ----------------------------
txt = ax1.text(0.5, 0.5, "test", size=30, ha="center", color="w")
kwargs = dict()

bbox_image = BboxImage(txt.get_window_extent,
                       norm=None,
                       origin=None,
                       clip_on=False,
                       **kwargs
                       )
a = np.arange(256).reshape(1, 256)/256.
bbox_image.set_data(a)
ax1.add_artist(bbox_image)

# ------------------------------------
# Create a BboxImage for each colormap
# ------------------------------------
a = np.linspace(0, 1, 256).reshape(1, -1)
a = np.vstack((a, a))

# List of all colormaps; skip reversed colormaps.
cmap_names = sorted(m for m in plt.colormaps if not m.endswith("_r"))

ncol = 2
nrow = len(cmap_names) // ncol + 1

xpad_fraction = 0.3
dx = 1 / (ncol + xpad_fraction * (ncol - 1))

ypad_fraction = 0.3
dy = 1 / (nrow + ypad_fraction * (nrow - 1))

for i, cmap_name in enumerate(cmap_names):
    ix, iy = divmod(i, nrow)

    bbox0 = Bbox.from_bounds(ix*dx*(1 + xpad_fraction),
                             1. - iy*dy*(1 + ypad_fraction) - dy,
                             dx, dy)
    bbox = TransformedBbox(bbox0, ax2.transAxes)

    bbox_image = BboxImage(bbox,
                           cmap=cmap_name,
                           norm=None,
                           origin=None,
                           **kwargs
                           )

    bbox_image.set_data(a)
    ax2.add_artist(bbox_image)

plt.show()

참조
다음 함수, 메서드, 클래스 및 모듈의 사용이 이 예제에 표시됩니다.