메모
전체 예제 코드를 다운로드 하려면 여기 를 클릭 하십시오.
채워진 다각형 #
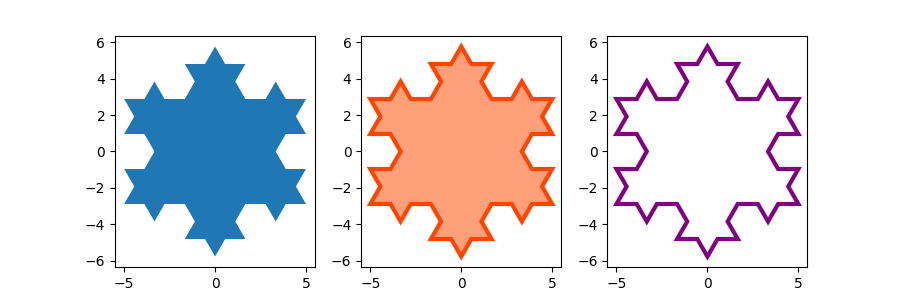
fill()점 좌표 x , y 목록을 기반으로 채워진 다각형을 그립니다 .
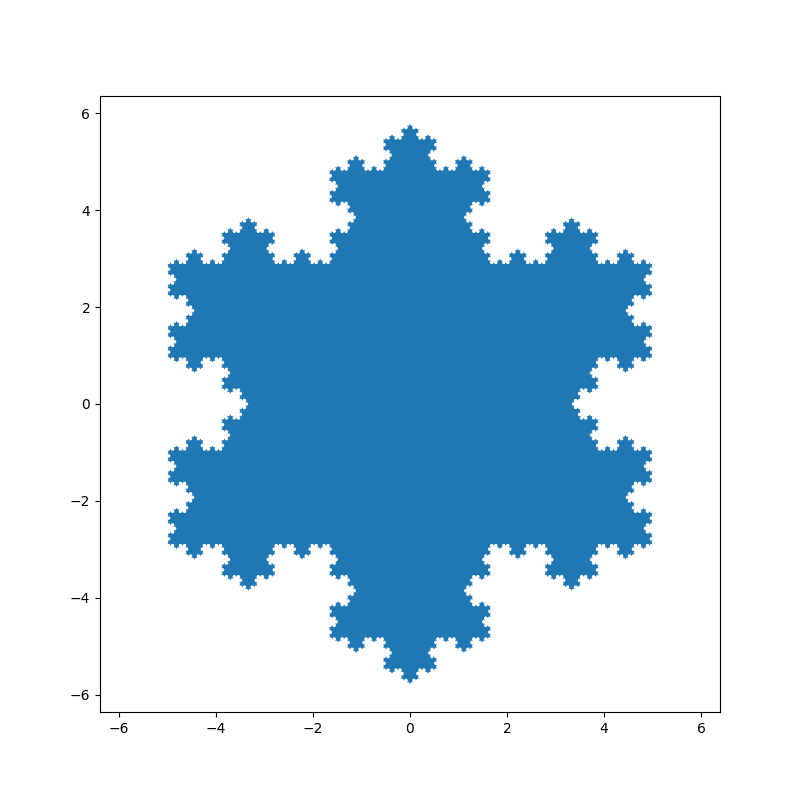
이 예제에서는 Koch 눈송이 를 예제 다각형으로 사용합니다.
import numpy as np
import matplotlib.pyplot as plt


def koch_snowflake(order, scale=10):
    """
    Return two lists x, y of point coordinates of the Koch snowflake.

    Parameters
    ----------
    order : int
        The recursion depth.
    scale : float
        The extent of the snowflake (edge length of the base triangle).
    """
    def _koch_snowflake_complex(order):
        if order == 0:
            # initial triangle
            angles = np.array([0, 120, 240]) + 90
            return scale / np.sqrt(3) * np.exp(np.deg2rad(angles) * 1j)
        else:
            ZR = 0.5 - 0.5j * np.sqrt(3) / 3

            p1 = _koch_snowflake_complex(order - 1)  # start points
            p2 = np.roll(p1, shift=-1)  # end points
            dp = p2 - p1  # connection vectors

            new_points = np.empty(len(p1) * 4, dtype=np.complex128)
            new_points[::4] = p1
            new_points[1::4] = p1 + dp / 3
            new_points[2::4] = p1 + dp * ZR
            new_points[3::4] = p1 + dp / 3 * 2
            return new_points

    points = _koch_snowflake_complex(order)
    x, y = points.real, points.imag
    return x, y
기본 사용법:

키워드 인수 facecolor 및 edgecolor 를 사용 하여 다각형의 색상을 수정합니다. 기본 Matplotlib 스타일에서 가장자리 의 선폭 이 0이므로 가장자리가 보이도록 설정해야 합니다.

참조
다음 함수, 메서드, 클래스 및 모듈의 사용이 이 예제에 표시됩니다.
스크립트의 총 실행 시간: ( 0분 1.147초)