메모
전체 예제 코드를 다운로드 하려면 여기 를 클릭 하십시오.
날짜 눈금 레이블 #
Matplotlib 날짜 플로팅은 날짜 인스턴스를 epoch(기본적으로 1970-01-01T00:00:00) 이후의 날짜로 변환하여 수행됩니다. 이
matplotlib.dates모듈은 변환기 기능 date2num
을 제공하고 Matplotlib의 내부 표현 으로
객체를 num2date변환 합니다. 이러한 데이터 유형은 에 설명된 단위 변환 메커니즘에 등록
되므로 변환은 사용자를 위해 자동으로 발생합니다. 등록 프로세스는 또한 축의 기본 눈금 및
을 및
로 설정합니다 .datetime.datetimenumpy.datetime64matplotlib.unitslocatorformatterAutoDateLocatorAutoDateFormatter
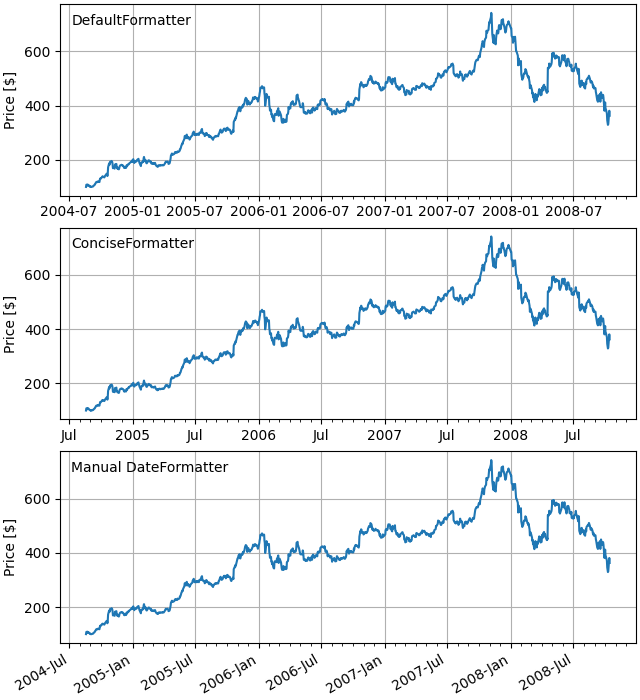
대체 포맷터는 아래
ConciseDateFormatter두 번째에서 사용되는 입니다 ( ConciseDateFormatter 를 사용하여 날짜 눈금 서식 지정 참조 ). 이는 눈금 레이블을 회전할 필요가 없는 경우가 많습니다. 마지막 형식은 에 문서화된 형식 문자열을 사용하여 날짜 형식을 지정하는 데 사용하여 날짜를 수동으로
형식화합니다 .AxesAxesDateFormatterdatetime.date.strftime

import matplotlib.pyplot as plt
import matplotlib.dates as mdates
import matplotlib.cbook as cbook

# Load a numpy record array from yahoo csv data with fields date, open, high,
# low, close, volume, adj_close from the mpl-data/sample_data directory. The
# record array stores the date as an np.datetime64 with a day unit ('D') in
# the date column.
data = cbook.get_sample_data('goog.npz', np_load=True)['price_data']

fig, axs = plt.subplots(3, 1, figsize=(6.4, 7), constrained_layout=True)
# common to all three:
for ax in axs:
    ax.plot('date', 'adj_close', data=data)
    # Major ticks every half year, minor ticks every month,
    ax.xaxis.set_major_locator(mdates.MonthLocator(bymonth=(1, 7)))
    ax.xaxis.set_minor_locator(mdates.MonthLocator())
    ax.grid(True)
    ax.set_ylabel(r'Price [\$]')

# different formats:
ax = axs[0]
ax.set_title('DefaultFormatter', loc='left', y=0.85, x=0.02, fontsize='medium')

ax = axs[1]
ax.set_title('ConciseFormatter', loc='left', y=0.85, x=0.02, fontsize='medium')
ax.xaxis.set_major_formatter(
    mdates.ConciseDateFormatter(ax.xaxis.get_major_locator()))

ax = axs[2]
ax.set_title('Manual DateFormatter', loc='left', y=0.85, x=0.02,
             fontsize='medium')
# Text in the x axis will be displayed in 'YYYY-mm' format.
ax.xaxis.set_major_formatter(mdates.DateFormatter('%Y-%b'))
# Rotates and right-aligns the x labels so they don't crowd each other.
for label in ax.get_xticklabels(which='major'):
    label.set(rotation=30, horizontalalignment='right')

plt.show()
스크립트의 총 실행 시간: (0분 1.408초)