메모
전체 예제 코드를 다운로드 하려면 여기 를 클릭 하십시오.
3D의 텍스트 주석 #
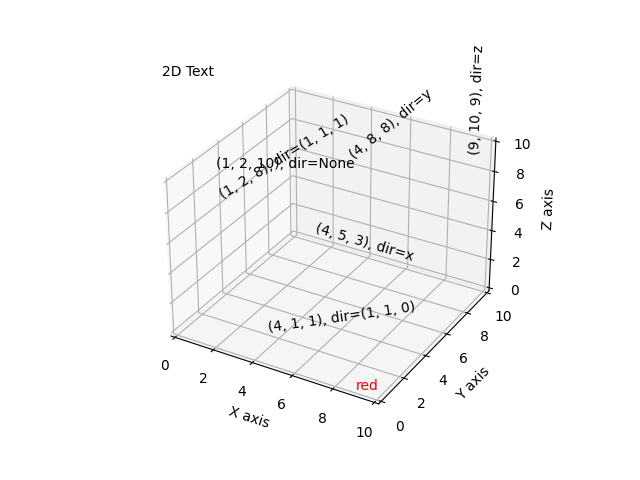
3D 플롯에서 텍스트 주석의 배치를 보여줍니다.
표시된 기능:
세 가지 유형의 'zdir' 값과 함께 텍스트 함수 사용: 없음, 축 이름(예: 'x') 또는 방향 튜플(예: (1, 1, 0)).
color 키워드와 함께 텍스트 기능을 사용합니다.
text2D 함수를 사용하여 ax 객체의 고정된 위치에 텍스트를 배치합니다.

import matplotlib.pyplot as plt


ax = plt.figure().add_subplot(projection='3d')

# Demo 1: zdir
zdirs = (None, 'x', 'y', 'z', (1, 1, 0), (1, 1, 1))
xs = (1, 4, 4, 9, 4, 1)
ys = (2, 5, 8, 10, 1, 2)
zs = (10, 3, 8, 9, 1, 8)

for zdir, x, y, z in zip(zdirs, xs, ys, zs):
    label = '(%d, %d, %d), dir=%s' % (x, y, z, zdir)
    ax.text(x, y, z, label, zdir)

# Demo 2: color
ax.text(9, 0, 0, "red", color='red')

# Demo 3: text2D
# Placement 0, 0 would be the bottom left, 1, 1 would be the top right.
ax.text2D(0.05, 0.95, "2D Text", transform=ax.transAxes)

# Tweaking display region and labels
ax.set_xlim(0, 10)
ax.set_ylim(0, 10)
ax.set_zlim(0, 10)
ax.set_xlabel('X axis')
ax.set_ylabel('Y axis')
ax.set_zlabel('Z axis')

plt.show()