메모
전체 예제 코드를 다운로드 하려면 여기 를 클릭 하십시오.
맞춤 티커 #
이 matplotlib.ticker모듈은 많은 프리셋 티커를 정의하지만 기본적으로 확장성, 즉 사용자 정의 티커를 지원하도록 설계되었습니다.
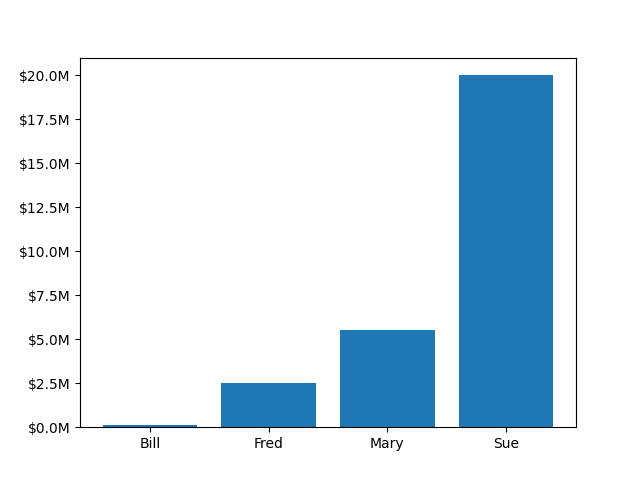
이 예제에서는 사용자 정의 함수를 사용하여 y축에서 수백만 달러 단위의 눈금 서식을 지정합니다.
import matplotlib.pyplot as plt


def millions(x, pos):
    """The two arguments are the value and tick position."""
    return '${:1.1f}M'.format(x*1e-6)


fig, ax = plt.subplots()
# set_major_formatter internally creates a FuncFormatter from the callable.
ax.yaxis.set_major_formatter(millions)
money = [1.5e5, 2.5e6, 5.5e6, 2.0e7]
ax.bar(['Bill', 'Fred', 'Mary', 'Sue'], money)
plt.show()
