메모
전체 예제 코드를 다운로드 하려면 여기 를 클릭 하십시오.
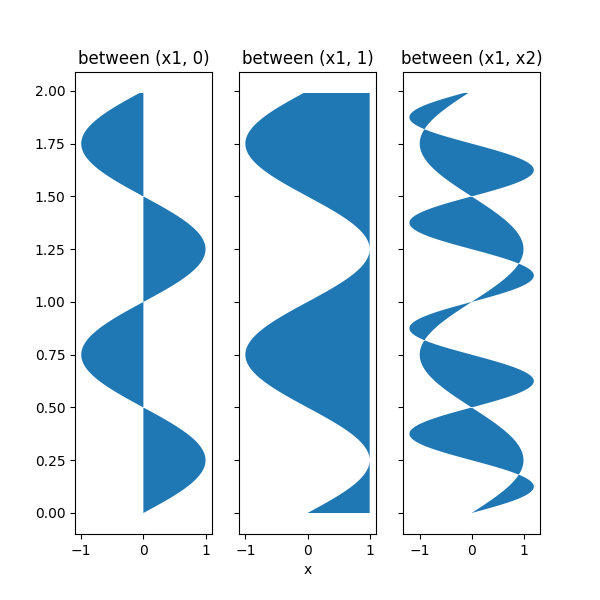
비트윈x 데모 채우기 #
fill_betweenx두 곡선 사이의 가로 방향을 따라 색상을 지정하는 데 사용 합니다.
import matplotlib.pyplot as plt
import numpy as np


y = np.arange(0.0, 2, 0.01)
x1 = np.sin(2 * np.pi * y)
x2 = 1.2 * np.sin(4 * np.pi * y)

fig, [ax1, ax2, ax3] = plt.subplots(1, 3, sharey=True, figsize=(6, 6))

ax1.fill_betweenx(y, 0, x1)
ax1.set_title('between (x1, 0)')

ax2.fill_betweenx(y, x1, 1)
ax2.set_title('between (x1, 1)')
ax2.set_xlabel('x')

ax3.fill_betweenx(y, x1, x2)
ax3.set_title('between (x1, x2)')
Text(0.5, 1.0, 'between (x1, x2)')
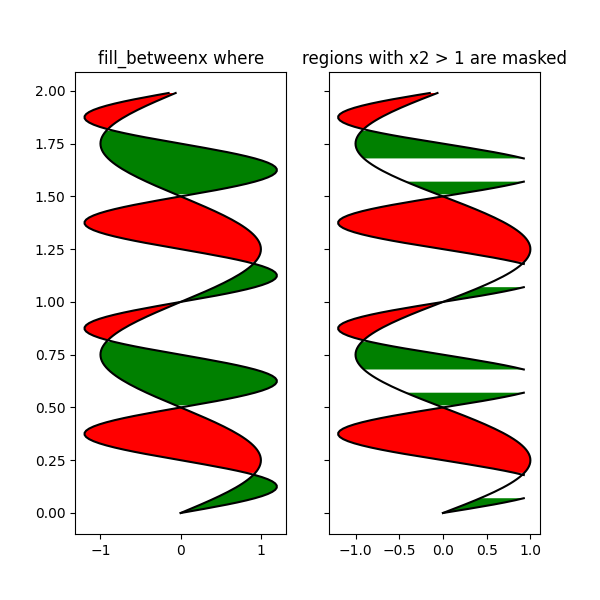
이제 논리 조건이 충족되는 x1과 x2 사이를 채웁니다. 이것은 다음을 호출하는 것과 다릅니다.
여러 인접 영역에 대한 가장자리 효과 때문입니다.
fig, [ax, ax1] = plt.subplots(1, 2, sharey=True, figsize=(6, 6))
ax.plot(x1, y, x2, y, color='black')
ax.fill_betweenx(y, x1, x2, where=x2 >= x1, facecolor='green')
ax.fill_betweenx(y, x1, x2, where=x2 <= x1, facecolor='red')
ax.set_title('fill_betweenx where')

# Test support for masked arrays.
x2 = np.ma.masked_greater(x2, 1.0)
ax1.plot(x1, y, x2, y, color='black')
ax1.fill_betweenx(y, x1, x2, where=x2 >= x1, facecolor='green')
ax1.fill_betweenx(y, x1, x2, where=x2 <= x1, facecolor='red')
ax1.set_title('regions with x2 > 1 are masked')
Text(0.5, 1.0, 'regions with x2 > 1 are masked')
이 예는 문제를 보여줍니다. 데이터 그리드로 인해 교차 지점에 원하지 않는 채워지지 않은 삼각형이 있습니다. 무차별 대입 솔루션은 플로팅하기 전에 모든 배열을 매우 미세한 그리드로 보간하는 것입니다.
plt.show()
스크립트의 총 실행 시간: ( 0분 1.113초)